
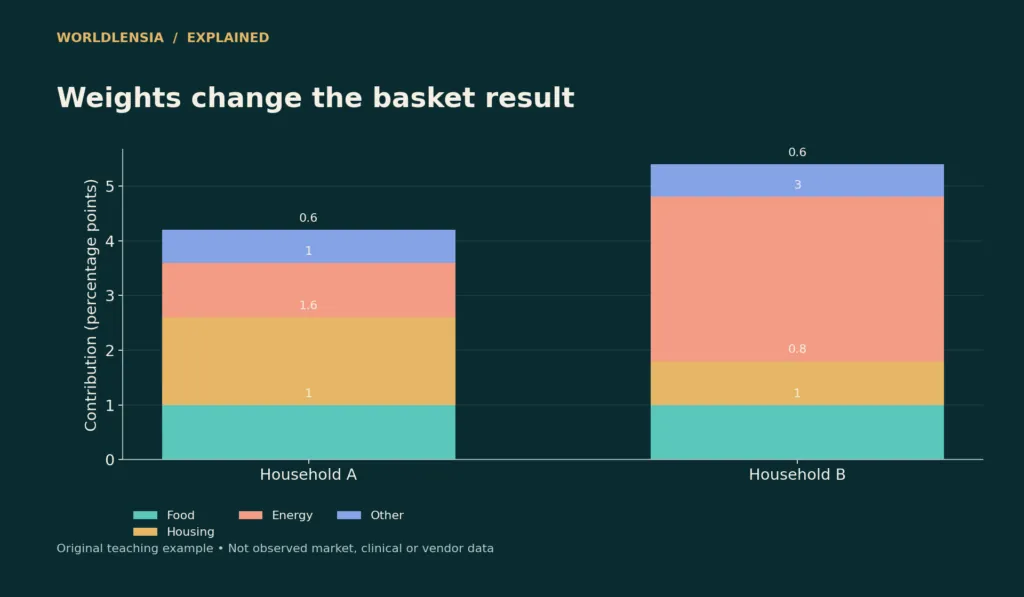
The inflation rate vs CPI comparison can look different for two households because their spending weights differ. A household that spends more on a category with rising prices feels more of that change than one that spends less there. The Consumer Price Index represents a defined population and methodology; it is not an exact measure of every household’s budget.
BLS explains that a person's inflation experience can differ from its published averages. That does not by itself show the index is wrong or that a personal budget calculation is an official alternative index.
Inflation rate vs CPI: use a small basket to see the effect
Take a fictional four-category basket. Food prices rise 5%, housing 4%, energy 10%, and other prices 2%. Household A spends 20%, 40%, 10%, and 30% in those categories. A fixed-basket weighted calculation gives 4.2%: 1.0 + 1.6 + 1.0 + 0.6 percentage points.
Household B spends 20%, 20%, 30%, and 30%. Its result is 5.4%. The price changes are identical; energy has more influence because its budget weight is larger. These are simplified original examples, not current CPI weights or measured household inflation.
| Category | Price change | A weight | B weight |
|---|---|---|---|
| Food | 5% | 20% | 20% |
| Housing | 4% | 40% | 20% |
| Energy | 10% | 10% | 30% |
| Other | 2% | 30% | 30% |
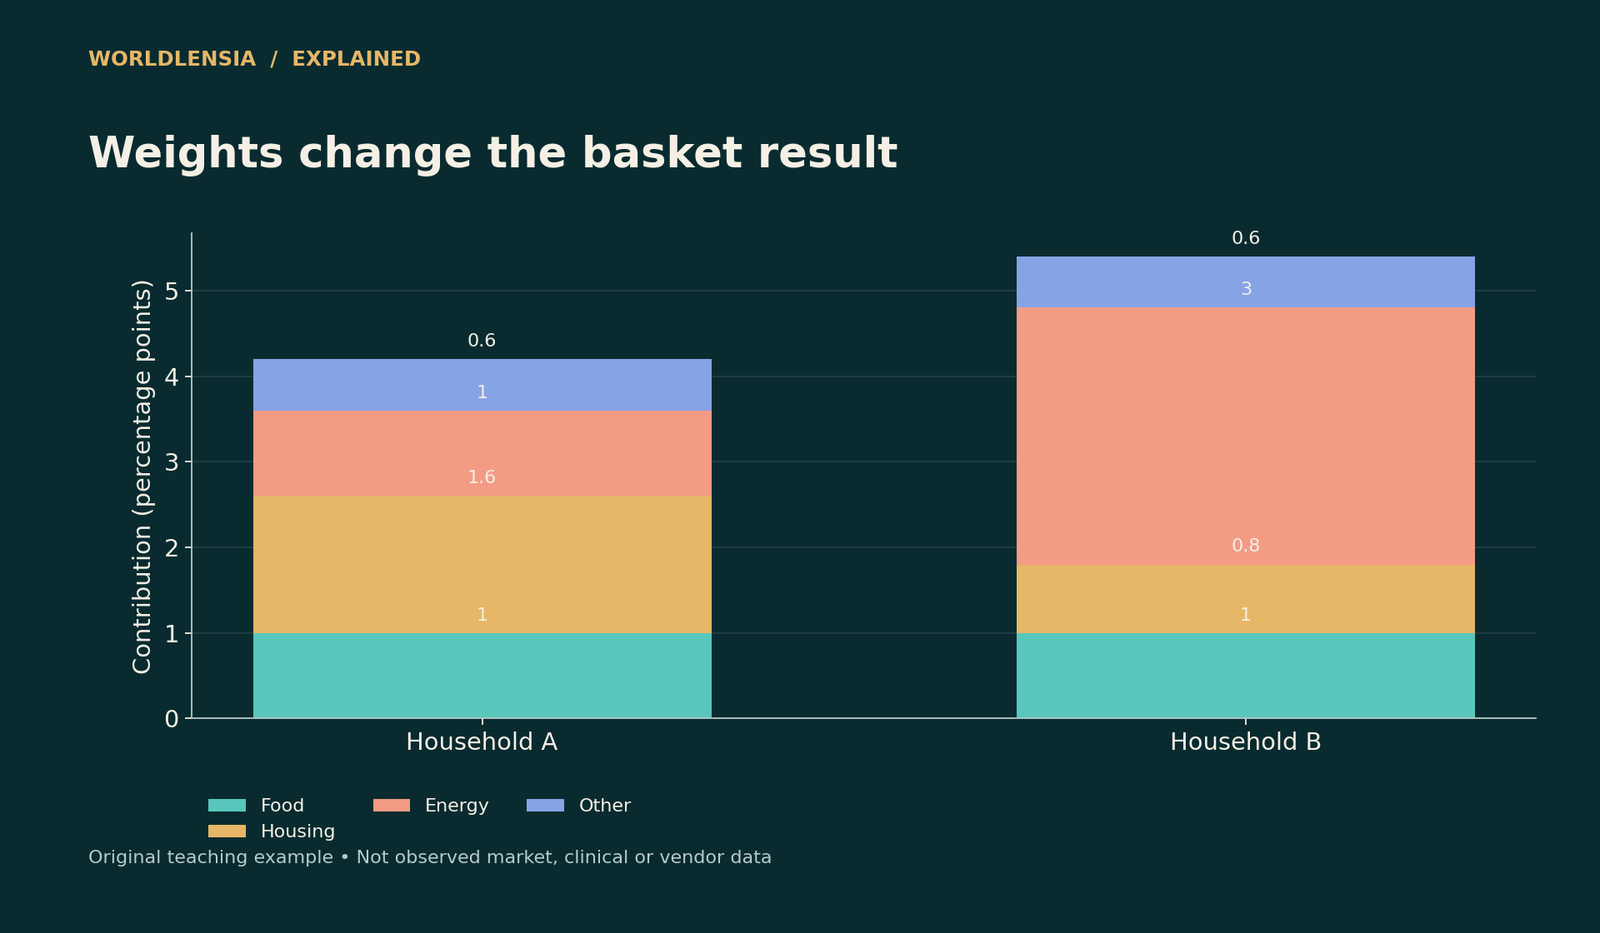
Figure data and assumptions
Original hypothetical teaching data; see the caption and article for assumptions.
| Category | Food | Housing | Energy | Other |
|---|---|---|---|---|
| Household A | 1.0 | 1.6 | 1.0 | 0.6 |
| Household B | 1.0 | 0.8 | 3.0 | 0.6 |
The accompanying contribution chart makes the arithmetic visible. It does not reproduce the full CPI methodology, which involves detailed index construction and more categories than this teaching basket.
Separate prices from buying more
A monthly grocery bill can rise because food prices rose, because the household bought more food, or because it chose different products. Comparing total spending alone cannot isolate the price component. Keep quantities and product quality comparable when building a personal illustration.
For a separate food-at-home budget comparison, use the household grocery budget calculator. It compares food-only spending with dated USDA plan benchmarks after accounting for household members and size. A gap from that benchmark is not a personal inflation rate or evidence that prices alone changed.
Similarly, moving to a larger apartment can increase housing spending without demonstrating that the same apartment became more expensive. A budget change matters to the household, but its explanation is different from pure price inflation.
Start from actual spending records
For a practical budget review, group a representative period of spending into meaningful categories. Include less frequent expenses so one unusually quiet month does not distort the weights. Check that the shares sum to 100% and that reimbursements or transfers are not counted as ordinary consumption twice.
Then state the price-change measure used for each category. A national category index may be an imperfect match for a particular location or product. The calculation should disclose that approximation instead of presenting excessive decimal precision.
Housing requires special care
The cost of owning a home, a mortgage payment, and the housing services represented in a consumer price index are not identical concepts. A change in interest payments or a house purchase price should not be substituted automatically for the CPI housing component.
For a household decision, a cash-flow budget can be the right tool even though it is not an inflation index. Report that distinction plainly. Readers can understand both their actual monthly payment and the official price measure without forcing the two into the same definition.
Weights can change
Households substitute products, change transportation, or move. A fixed starting basket isolates one question: what would the old basket cost after the price changes? A current-spending comparison asks a different question because quantities and composition have also changed.
Document the reference period and method. If you update weights every month, do not casually compare the resulting series with an older fixed-weight calculation as if only prices changed. The methodology is part of the result.
Read a contribution correctly
In Household A, energy contributes one percentage point to the 4.2% total. Energy prices themselves rose 10%. A contribution is a weighted influence on the overall result; it is not the category's own inflation rate.
This is the same general distinction that makes percentage points useful in other data stories. WorldLensia's percent-versus-percentage-points guide can help avoid saying a category caused “10% inflation” when its actual contribution depends on its weight.
Reproduce the calculation with currency amounts
Use a fictional starting budget of $1,000 for Household A. The category amounts are $200 for food, $400 for housing, $100 for energy, and $300 for other purchases. Holding quantities fixed, the new costs are $210, $416, $110, and $306. Their total is $1,042.
The $42 increase divided by the $1,000 starting total is 4.2%. For Household B's $1,000 basket, the starting amounts are $200, $200, $300, and $300. The corresponding new costs are $210, $208, $330, and $306, totaling $1,054. The direct currency method reproduces the weighted result.
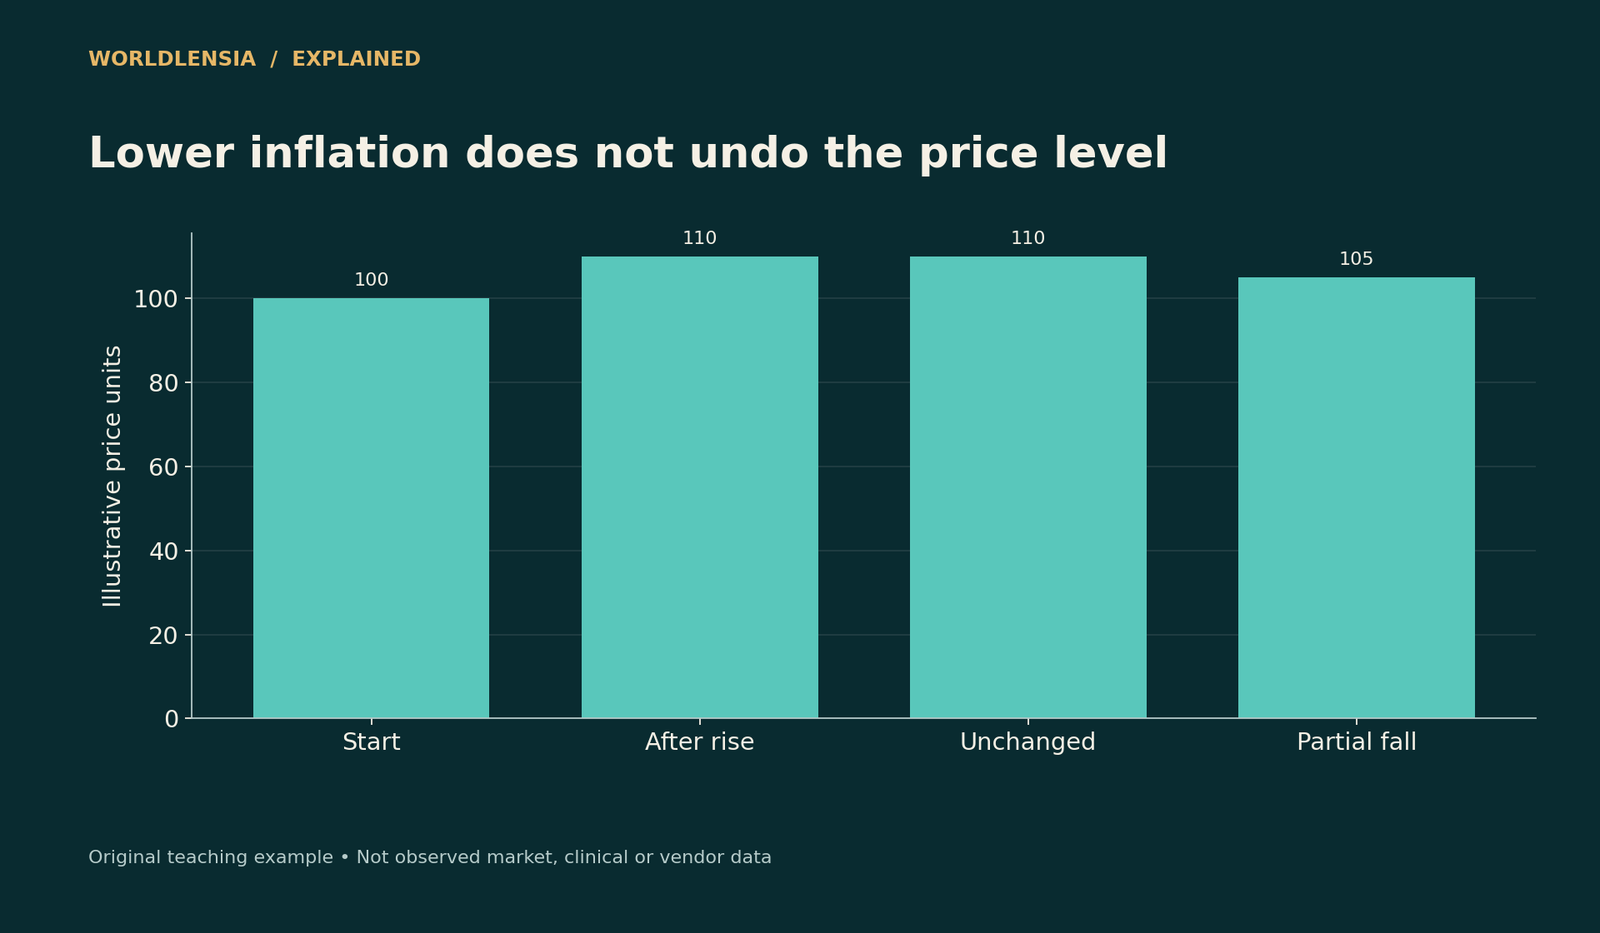
Figure data and assumptions
Original hypothetical teaching data; see the caption and article for assumptions.
| Category | Price |
|---|---|
| Start | 100.0 |
| After rise | 110.0 |
| Unchanged | 110.0 |
| Partial fall | 105.0 |
This check is valuable because contribution tables can contain subtle unit errors. A category's price change is a percentage of that category's base cost; its contribution is the increase as a share of the entire base basket. Keeping a currency worksheet beside the percentages makes the distinction easier to audit.
Show what happens when quantities change
Suppose Household A reduces energy quantity by 10% after the energy price rises 10%. Its new energy spending is $100 × 1.10 × 0.90 = $99. The household spends less on energy even though the price rose. Multiplying the changes produces a different result from subtracting ten percentage points from ten.
This does not prove that the household maintained the same standard of living. It may have reduced comfort, found an efficiency improvement, or changed activities. The spending record alone does not identify which explanation is correct.
A personal budget review should therefore separate the price of a comparable item, the quantity consumed, and any change in quality or service. An official price index has its own methods for these issues; the simplified exercise here is not a replacement for them.
Use a common comparison period
Monthly and annual changes answer different questions. Comparing this month's price with last month's is not the same as comparing with the same month a year earlier. A household bill received this month can also cover consumption from an earlier period.
Keep start and end dates consistent across categories. If food uses a year-over-year change and energy uses one month, the weighted total has no coherent period. A spreadsheet can still calculate a number, but the result should not be published as a meaningful annual personal inflation rate.
For seasonal expenses, a longer representative spending window can help avoid a misleading weight. A winter heating bill should not automatically define the energy share for the entire year. Document the choice rather than allowing the latest statement to decide the basket accidentally.
Distinguish a price level from a rate of change
If a price rises from $100 to $110 and then stays at $110, the second period has zero additional inflation for that item while the price remains above its original level. A lower inflation rate does not mean the earlier price increase has reversed.
Conversely, a fall from $110 to $105 is a decline of about 4.55%, not a full reversal of the earlier 10% rise. The final price is still 5% above the starting $100. Base values matter in both directions.
When readers say prices still feel high despite lower inflation, distinguish the level from the current pace of increase. That clarification can resolve a disagreement that otherwise sounds like a dispute about whether the data are truthful.
Keep the chart's claim narrow
A contribution chart should label the basket, weights, price period, and method. In this article every value is hypothetical. In an article using real data, retain the source series for each category and show how categories were matched.
Do not use a red upward line simply to suggest crisis when the evidence is a small change in a fictional example. The visual should explain the calculation. If a reader cannot tell whether it is observed data, a forecast, or a teaching scenario, the caption needs improvement before publication.
Use personal calculations for the question they can answer
A household basket can identify which categories explain a budget increase under stated assumptions. It cannot, by itself, establish the inflation experienced by all households, evaluate a national statistical agency, or determine a wage adjustment that suits every worker.
If comparing two households, avoid interpreting a higher personal rate as evidence that one household made poor choices. Their needs, location, health, housing, transport access, and family circumstances can differ. The arithmetic describes exposure; it does not assign responsibility.
For publication, show the starting amounts, category price changes, and final amounts in a small table. A reader should be able to reproduce the result without trusting a hidden spreadsheet. If a category is approximated, say so in the same section rather than leaving the qualification only in a distant footnote.
The strongest explanation connects each percentage point to a defined part of spending. That turns a disagreement about an abstract average into a checkable account of what changed.
A useful takeaway for readers
Use CPI for the population and purpose it describes. Use a carefully labeled personal basket to understand budget exposure. If the two differ, investigate weights, product choices, location, timing, and measurement concepts before concluding that one must be false.
Treat an omitted category explicitly
If a personal worksheet excludes a large expense because no matching price series is available, its result applies to the included basket only. Do not label it inflation for the entire household budget without explaining the omission. One option is to report category exposure separately rather than force an incomplete total. Another is to use a clearly justified approximation and test how much it affects the result. The important requirement is transparency: a missing category should remain visible, not disappear because the calculation produces a convenient percentage.
Sources and methodology
BLS CPI FAQs, the individual-experience factsheet, and relative-importance materials were checked October 18, 2026. The four-category basket, weights, and calculations are original illustrations, not official CPI estimates or household survey observations.
- BLS: CPI FAQs — checked October 18, 2026.
- BLS: CPI weights — checked October 18, 2026.
- BLS: Individual inflation experience — checked October 18, 2026.
Continue with Percent versus percentage points and Seasonal adjustment explained for related context.
For an everyday example of category-level price changes, see our USDA grocery budget guide for one person.
To apply spending weights to grocery costs and earnings, see A Pay Rise and Real Earnings: Compare Wages with Prices and Hours.