
The September 2026 U.S. employment release reports a small payroll gain alongside a little-changed unemployment rate. These measures are related, but they come from different surveys and count different things. Understanding that distinction prevents a common mistake: expecting one headline to mechanically explain the other.
Jobs Report: At a glance
- BLS reports a September payroll increase of 29,000 and unemployment of 4.2%.
- Payroll estimates count jobs; the household survey classifies people.
- Use participation, revisions, and several months of data for context.
What the release reports
In the BLS release available on October 17, total nonfarm payroll employment increased by 29,000 in September, while the unemployment rate was 4.2%. BLS described both measures as little changed. The labor force participation rate was 61.8%. These are September observations, not forecasts for the next month.
The household survey supplies unemployment and participation measures. The establishment survey supplies payroll jobs, hours, and earnings. A person holding two qualifying payroll jobs can appear twice in the jobs count while remaining one employed person in the household framework.
A fictional labor-force example
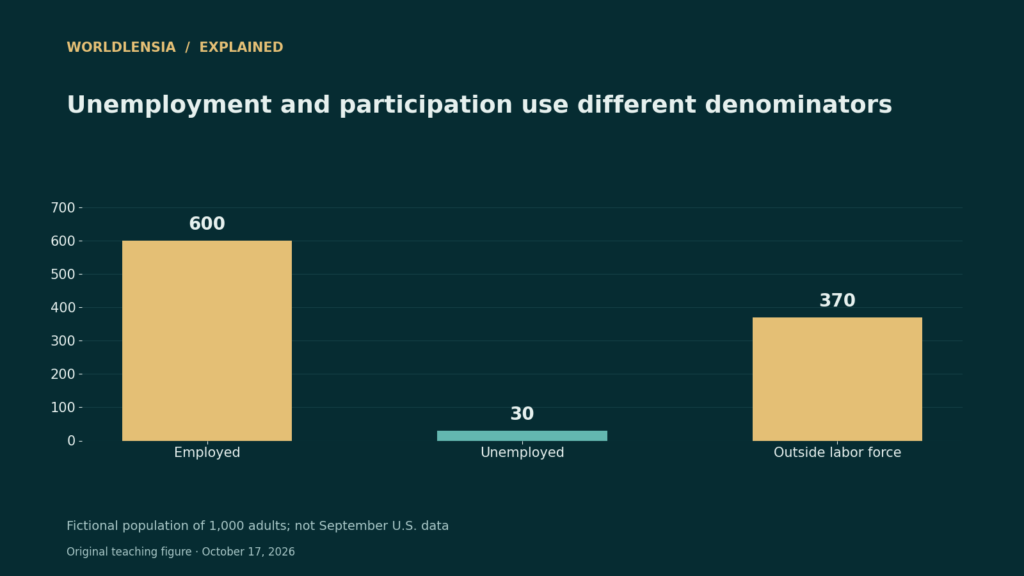
Suppose a town has 1,000 adults in the relevant population. Of these, 600 are working and 30 meet the definition of unemployed. Its labor force is 630, and unemployment is about 4.8%: 30 divided by 630. Participation is 63%: 630 divided by 1,000.
If 10 previously unemployed people stop looking and no longer meet the unemployment criteria, unemployment becomes about 3.2% even though employment remains 600. This illustrative calculation shows why a falling unemployment rate does not always mean more people found work. It is not an explanation of what happened nationally in September.
How to read the next release
Write down the reference month, publication date, whether figures are adjusted, and which earlier estimates changed. Do not compare a revised observation with a preliminary one without mentioning the difference.
For a business decision, match the geography and sector to the question. A national figure may be useful background but cannot establish hiring conditions for one occupation in one city. Seek the relevant local series before making that narrower claim.
A practical comparison
| Measure | Latest reported September value | What it describes |
|---|---|---|
| Nonfarm payroll change | +29,000 | Monthly change in jobs |
| Unemployment rate | 4.2% | Unemployed share of the labor force |
| Participation rate | 61.8% | Labor force share of the population |
Before using the result
- Keep jobs and people distinct.
- Check revisions and adjustment status.
- Use the correct population as the denominator.
Continue exploring: more economy and finance explainers.
Sources and methodology
Reviewed October 17, 2026. WorldLensia explanatory analysis. Worked examples and the accompanying teaching figure are illustrative, not measured findings or product tests. Consult the linked source for definitions and revisions.
To check the population denominator and calendar effects in the jobs figures, see Unemployment and Participation: Two Rates, Two Different Denominators and Seasonally Adjusted vs Unadjusted Data: Which Should You Use?.