
Median home sale prices show the middle price among homes sold in a defined sample. The figure can move because comparable properties became more expensive, because a different mix of properties sold, or both.
That distinction matters when a headline says “home values rose.” The median of transactions describes the homes that changed hands. It does not automatically measure the price change for the same property or the experience of every owner in the market.
What median home sale prices actually cover
The Census Bureau’s New Residential Sales historical-series page states that its data concern new privately owned residential units and do not collect information for existing homes. [1] Its Characteristics of New Housing program provides information about features of new residential structures. [2]
A new-home sales median should therefore not be silently relabeled as a median for every home in a city or the whole housing stock. Other datasets may cover existing homes, listings or appraisals, with different definitions.
Record the geography, transaction stage, property type and period. Asking prices are not completed sale prices, and a national new-home measure is not a direct estimate of a particular neighborhood.
A fictional median changes with the mix
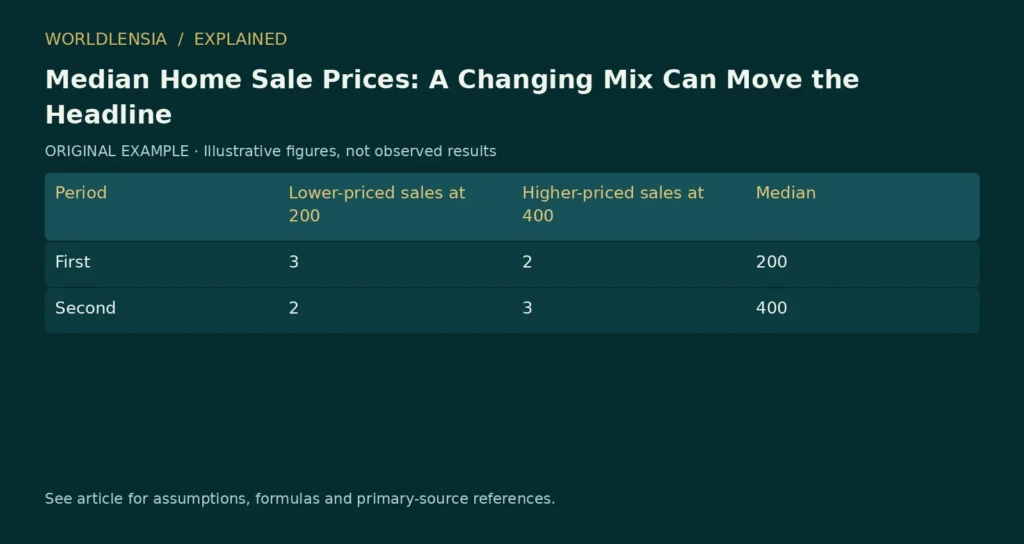
Suppose a market sells five homes in one period at prices of 200, 200, 200, 400 and 400 thousand currency units. The median is 200 because the third ordered observation is 200.
In the next period, the sales are 200, 200, 400, 400 and 400. The median becomes 400. Assume the lower-priced and higher-priced property types have unchanged prices; only the numbers sold differ.
| Period | Lower-priced sales at 200 | Higher-priced sales at 400 | Median |
|---|---|---|---|
| First | 3 | 2 | 200 |
| Second | 2 | 3 | 400 |
These invented data produce a 100% rise in the median without any assumed price increase within either type. The example is deliberately small to make the mechanism visible. It is not a claim that an actual housing-market movement has this cause.
Why the median is still useful
The median is less directly influenced by the size of an extreme transaction than the mean. It can give a useful description of the middle transaction in the observed distribution.
But resistance to extreme values does not make median home sale prices immune to composition. If the share of large, newly built or centrally located homes changes, the middle transaction can move. The data describe what sold, including that change in mix.
Show transaction counts and relevant property characteristics alongside the price statistic when available. A price change based on a small or unusual sales sample deserves a different interpretation from one supported by a broad, comparable set of transactions.
Choose a measure that fits a price-change question
A repeat-sales index or a model controlling for property characteristics aims to answer a different question from a raw median. Such methods have their own coverage and assumptions, which should be read rather than treated as perfect measures.
Our article on house-price indexes and affordability explains another boundary: even a carefully constructed price index does not determine whether a particular household can afford a home. Financing costs, income and other expenses matter separately.
If your question is what a typical transaction cost this month, a median may be relevant. If your question is whether a comparable home became dearer, seek evidence designed to address comparability.
Do not infer an individual valuation
A citywide median cannot establish the market value of one property. Its location, condition, size, transaction terms and comparable sales require their own assessment.
Nor does a falling median prove that every seller must accept less. The mix could shift toward smaller properties while prices within some segments remain stable or rise. Avoid translating an aggregate change directly into a universal household outcome.
The fictional example illustrates a possible mechanism. To explain an actual release, inspect the available breakdowns and methodology. If the evidence does not separate mix from price change, state that uncertainty.
Compare releases consistently
Use the same dataset and period convention for both observations. Identify revisions, seasonal treatment and whether the price figures are nominal. A release date is different from the period in which sales occurred.
Avoid combining one provider’s first-period median with another provider’s second-period median unless their coverage is demonstrably compatible. A precise percentage calculation does not make mismatched sources comparable.
A clear headline says “the median price of homes sold increased,” then explains what is known about transaction mix. That wording preserves the useful information in the statistic without claiming it measures the change in every home’s value.
Compare the mean in the same fictional market
In the first five-sale example, the mean is (200 + 200 + 200 + 400 + 400)/5 = 280 thousand currency units. In the second, it is (200 + 200 + 400 + 400 + 400)/5 = 320 thousand. The mean rises by about 14.3%, while the median doubles.
Both summaries change because the transaction mix changed. The difference in their movements reflects where the observations sit and how each statistic summarizes them. A headline should not choose whichever percentage looks more dramatic without explaining the measure.
This is also why the median should not be described as an average in a way that obscures the method. It is a particular measure of center. Give the correct label and the number of sales.
Separate a market shift from a within-segment shift
Extend the invented market to two property types. In one scenario, each type keeps the same price while its sales share changes. In another, the shares stay the same while both type-specific prices rise. A third combines both effects.
The aggregate median alone does not identify which scenario occurred. Breakdowns by size, region or property type can help, but only if the categories are relevant and the sample supports them. A small segment can have unstable results.
If detailed data are unavailable, state that the change may include composition effects. That is a measurement limit, not evidence that the entire observed movement is artificial.
A new-home market and an existing-home market can move differently
The new-home series cited here has a specific universe. A local existing-home dataset may reflect different properties, sellers and transaction processes. Their medians can differ without either being wrong.
For a regional article, identify which market the reader is trying to understand. A buyer considering existing apartments in one neighborhood may gain little from treating a national new-house median as a direct price guide.
Do not combine the two universes into a single trend by switching sources between periods. If the article discusses both, present separate series and explain their coverage.
A confidence interval does not remove composition
Sampling uncertainty and composition are separate issues. A precise estimate of the median transaction price can still change because a different set of homes sold. An uncertainty interval addresses the statistical question defined by the source; it does not turn the statistic into a repeat-property index.
Likewise, a large sample can reduce some sampling noise while leaving systematic coverage differences. A dataset that excludes certain transaction types remains limited to its stated coverage even if it contains many observations.
Use uncertainty information where supplied, but keep the conceptual interpretation visible. A reader needs to know both how uncertain the estimate is and what quantity it estimates.
Build an original explanatory chart without inventing market data
For an educational article, a transparent dot plot of the two five-sale examples can show the changing mix. Label every value as fictional and use the same axis in both periods. Mark the median position rather than drawing a trend line through invented observations.
The caption should say that property-type prices are held fixed by assumption. This prevents a reader from interpreting the visual as evidence of a real market doubling in price.
If a chart instead uses real observations, attach the source, period, geography and selection rule. Do not mix fictional and actual values in one series without clear separation.
Connect the statistic to a practical question
An owner asking whether a specific home has appreciated needs evidence about comparable properties and the local market. A policymaker describing which homes sold may find the transaction median useful. A household assessing affordability needs income, financing and ownership-cost information as well.
The article should name which question it answers. That prevents a valid summary of transactions from becoming an unsupported valuation, forecast or affordability claim.
A transparent price discussion can acknowledge that the median moved substantially while remaining cautious about the mechanism. The strongest account preserves the observed fact, identifies the relevant market and shows what additional evidence would distinguish price changes from changes in the homes sold.
A recurring housing chart should retain the number of transactions and any exclusions with each period. If a later update adds previously unreported sales, the median can change even without new transactions in that earlier month. Distinguish that revision from a fresh market movement. The source date, observation period and transaction universe together make the statistic reproducible; an article timestamp alone does not preserve those details.
Keep new-home, existing-home and listing universes separate in every update, including the chart title and downloadable data.
Sources and method
- Census new residential sales historical series. Living series page; publication date not established. Checked October 20, 2026.
- Census characteristics of new housing. Living data page; publication date not established. Checked October 20, 2026.
Numerical teaching examples are original and illustrative unless explicitly identified otherwise. No hands-on product testing or individual medical assessment is claimed.
To separate the sales mix from affordability and area-based comparisons, see Price per Square Foot: Compare the Area Definition Before the Ratio.