
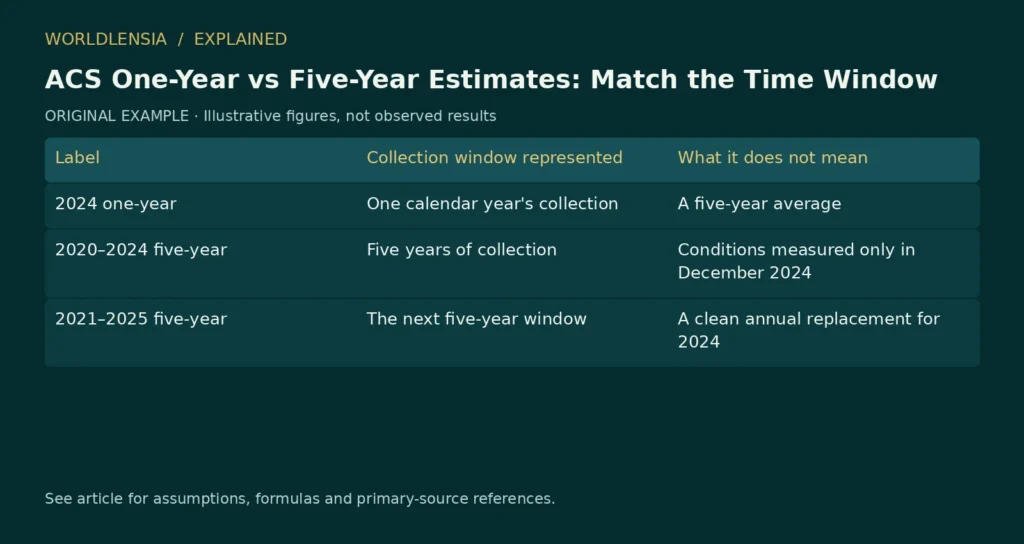
ACS one-year estimates represent a single year’s collection, while ACS five-year estimates pool data across five years. It is not a measurement of only the final year, and it should not be treated as a simple substitute for a one-year estimate with the same ending date.
The choice affects which places can be compared, how current the result is and what a change over time means. A useful city comparison begins with a consistent estimate type and period, before any ranking or percentage calculation.
Choose the estimate that fits the question
The Census Bureau’s guidance distinguishes one-year and five-year American Community Survey estimates by collection period, availability and statistical precision. [1] Its comparison guidance advises using non-overlapping five-year periods when making multiyear comparisons and explains other compatibility checks. [2]
A one-year estimate can be useful for a more recent view where it is available and suitable for the question. A five-year estimate pools more collection time and supports smaller geographic areas, but its period is broader. Neither is universally the “better” number.
If the goal is to compare several small places, use a compatible product available for all of them. Do not fill gaps in a one-year ranking with five-year values and present the resulting list as one consistent annual comparison.
Read the entire period label
Consider these fictional labels, used only to show the timing distinction.
| Label | Collection window represented | What it does not mean |
|---|---|---|
| 2024 one-year | One calendar year’s collection | A five-year average |
| 2020–2024 five-year | Five years of collection | Conditions measured only in December 2024 |
| 2021–2025 five-year | The next five-year window | A clean annual replacement for 2024 |
Always check the actual product’s reference-period and inflation-adjustment notes as well. Different questions in a survey can refer to different time concepts. A simple label cannot carry every methodological detail.
For dollar-valued estimates, read the guidance about the price basis before calculating growth. The fact that two values are expressed in dollars does not establish that they represent the same purchasing power.
Why overlapping windows complicate a trend
The 2020–2024 and 2021–2025 windows share four collection years. Their difference reflects the replacement of part of the window and any other relevant methodological factors. It is not a direct observation of the change from 2024 to 2025.
A fictional rolling average makes the mechanics visible. Suppose five annual values are 10, 10, 10, 10 and 20. Their simple average is 12. Replace the first 10 with a new value of 20 and the five-value average becomes 14. The rolling average rises by two even though the newly added value differs from the removed value by ten.
Actual ACS estimates are survey estimates with their own weighting and methods, rather than this simple arithmetic exercise. The illustration explains shared-window timing; it is not a formula for reconstructing ACS estimates from annual values.
Non-overlapping periods still need careful interpretation
Comparing 2015–2019 with 2020–2024 avoids shared collection years, but it does not isolate one annual event. Each estimate covers a broad period. A change might reflect many economic, demographic and policy developments.
Also confirm that the geographic boundaries, population universe, question definitions and table variables remain compatible. A non-overlapping time window cannot repair a changed definition or a boundary mismatch.
If the purpose is to explain a recent local shock, a five-year comparison may provide background rather than an immediate measurement of its effect. Look for appropriately timed administrative or other data when available, and explain their own limitations rather than mixing them silently.
Keep uncertainty beside the estimate
A point estimate is not exact simply because it comes from an official source. Carry the associated margin of error or other uncertainty information through the comparison. Our article on ACS margins of error explains why small numerical differences may not support a precise city ranking.
Do not decide significance by looking only at which estimate is larger. Use the Census Bureau’s appropriate comparison method, including any assumptions about the estimates’ relationship. Overlapping periods require particular care because their shared information affects dependence.
When a table contains estimates with very different uncertainty, report that contrast. A ranking that gives every row the same visual precision can mislead readers about how confidently places can be distinguished.
Make the comparison reproducible
A compact source note should name the ACS product, complete period, table and variable identifiers, geography and retrieval date. Save the original values and uncertainty measures before calculating a derived comparison.
Use a title such as “Median household income, ACS 2020–2024 five-year estimates” rather than “Income in 2024.” The longer label makes the period visible at the point where readers interpret the chart.
A good analysis does not hide the choice of time window in a footnote after presenting a dramatic annual claim. It chooses a window that answers the question and explains the level of timing detail that the data can reasonably support.
Work through a city-comparison request
Suppose an editor asks which of three fictional places has the highest household income “this year.” The first task is to clarify the available evidence, not to calculate a rank immediately. Check whether a compatible estimate exists for all three places and what collection period it represents.
If one place lacks the selected one-year product, mixing its five-year estimate into the table would change the timing question for that row. A consistent five-year comparison may be a better answer to a broader question, provided the headline names the full window.
If the editor’s real question concerns a very recent event, acknowledge that the available ACS product may not resolve it. A carefully labeled historical comparison is useful background, but it should not be presented as a direct measure of the event’s immediate effect.
Make an inventory before downloading values
Create one row for each proposed observation with fields for place, geographic identifier, estimate product, collection period, table, variable, universe, dollar basis and uncertainty measure. Completing these fields first often reveals an incompatibility before it reaches a chart.
Then retrieve the values and preserve the source response. If a geography is renamed or a boundary changes, use the identifier and source documentation rather than assuming the same display name means the same area.
For each derived calculation, record whether it is a level difference, percentage-point change or percentage change. A change in a proportion should not automatically be labeled as a percent change; those calculations answer different questions.
A rolling-window example can show direction without identifying the year
Consider two fictional five-observation sets. The first is 10, 12, 14, 16 and 18, with a simple mean of 14. The next is 12, 14, 16, 18 and 20, with a mean of 16. The rolling mean rises by two because the entering value of 20 replaces the departing 10 across five observations.
This arithmetic does not reveal every intermediate annual movement from the two means alone. Many different annual sequences can produce the same pair of window summaries.
Again, actual ACS estimates are not reconstructed using this simple average. The exercise demonstrates why overlapping summaries do not supply a complete annual history. A chart that draws a smooth annual narrative from them can imply timing precision that the source does not support.
Keep a revision log for a recurring comparison
If a city guide is updated each year, retain the previous extract and the exact product used. Do not overwrite the data file without preserving the version. A change in the published comparison could arise from a new collection window, corrected data or a different query.
Write the update note around the actual change. “Updated with a new five-year window” is more informative than changing a date at the top while leaving an annual-sounding headline.
If an earlier article mixed products, correct the comparison and explain the methodological change. Avoid silently interpreting the revised ranking as a newly observed local development.
Decide whether a ranking is necessary
A side-by-side table may answer the reader’s question without assigning a precise first, second and third place. If estimates are close relative to uncertainty, a rank can make the comparison look more decisive than it is.
For a practical city guide, explain the range, the population represented and any limitations relevant to the reader. Household income is one dimension of a place; it is not a complete assessment of living costs, services or individual opportunity.
A well-labeled time window is therefore part of the article’s explanation, not merely source housekeeping. It tells the reader which question the comparison can answer and prevents a broad period estimate from being mistaken for a snapshot of the present moment.
Keep the downloaded labels with the values
Do not discard variable labels after creating a short chart label. Retain the full source wording in the working file, including the population universe and period. If a later update changes the variable, the original label helps identify the difference. A compact mobile presentation can use shorter wording while an accessible source note preserves the full definition needed to reproduce the comparison. This protects a recurring article from silently changing its question during an update.
Sources and method
- Census using one-year or five-year ACS data. Living guidance; publication date not established. Checked October 20, 2026.
- Census comparing ACS data. Living guidance; publication date not established. Checked October 20, 2026.
Numerical teaching examples are original and illustrative unless explicitly identified otherwise. No hands-on product testing or individual medical assessment is claimed.
To compare ACS windows alongside geography and uncertainty, see City vs Metro Population: Why the Boundary Changes the Answer.