Countries & Cities
Compare city growth, population density, rents and urban indicators, with clear geographic definitions, data vintages and reproducible examples.
October 22, 2026 · Countries & Cities
Learn when to compare percentage growth and when to count residents added, using Celina and Charlotte plus a clearly labeled fictional calculation exercise.
Read the article → October 21, 2026 · Countries & Cities
See the fastest-growing U.S. cities in 2025 by percentage and by residents added, using Census Vintage 2025 data for places with 20,000+ people.
Read the article → October 21, 2026 · Countries & Cities
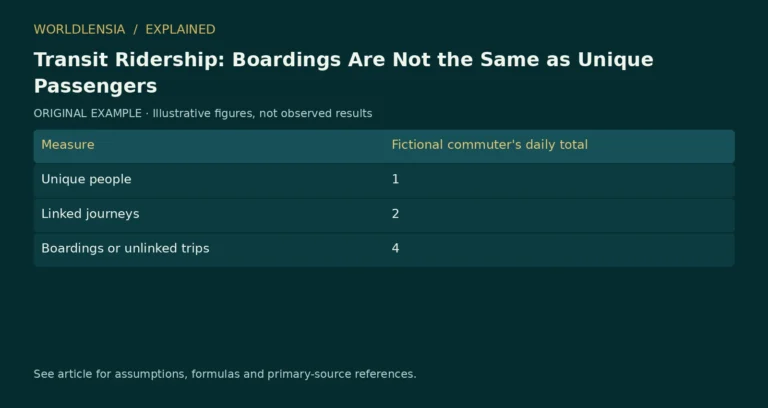
Read transit ridership correctly by distinguishing boardings, linked journeys, unique passengers and passenger miles.
Read the article → October 21, 2026 · Countries & Cities
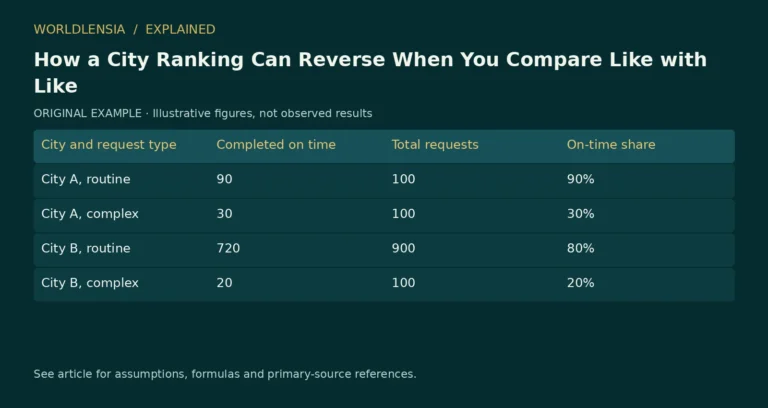
Use a fictional city-service example to understand Simpson’s paradox, weighted averages and why aggregate rankings need context.
Read the article → October 21, 2026 · Countries & Cities
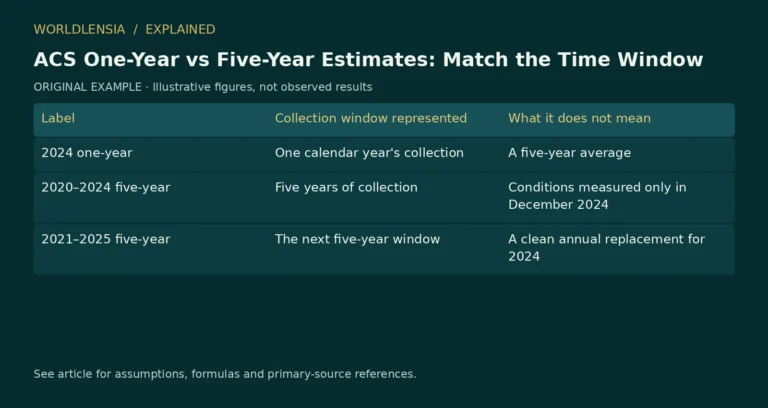
Choose ACS one-year or five-year estimates by purpose and avoid interpreting overlapping multiyear windows as annual changes.
Read the article → October 21, 2026 · Countries & Cities
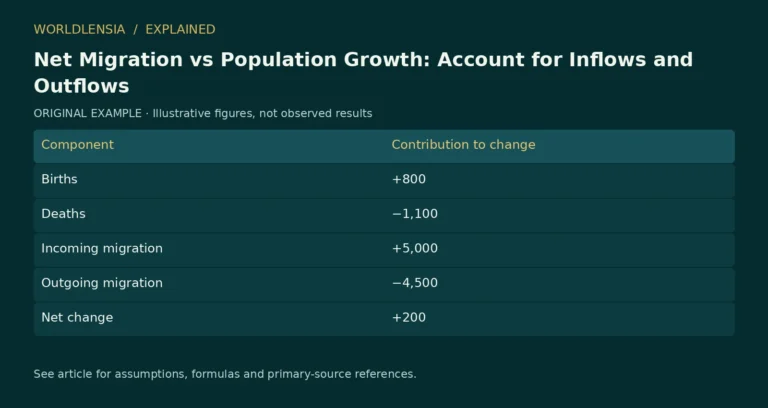
Distinguish net migration, gross moves and total population change with a worked demographic balance and source-coverage checks.
Read the article → October 20, 2026 · Countries & Cities
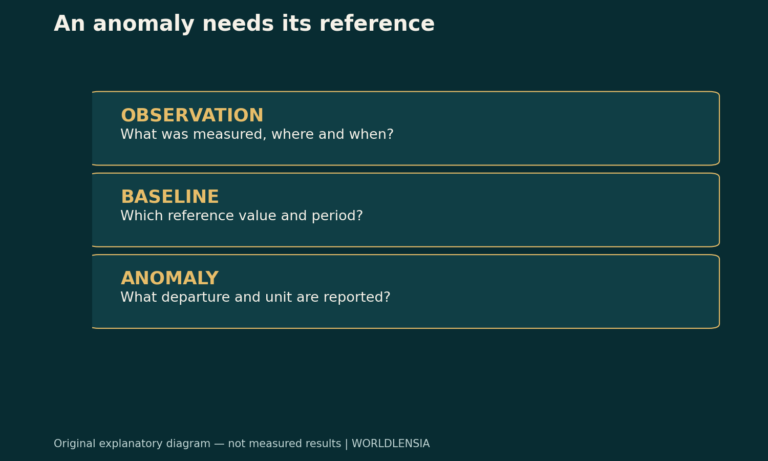
Read climate anomalies with their reference periods and units, using an example that separates a baseline change from a physical change.
Read the article → October 20, 2026 · Countries & Cities
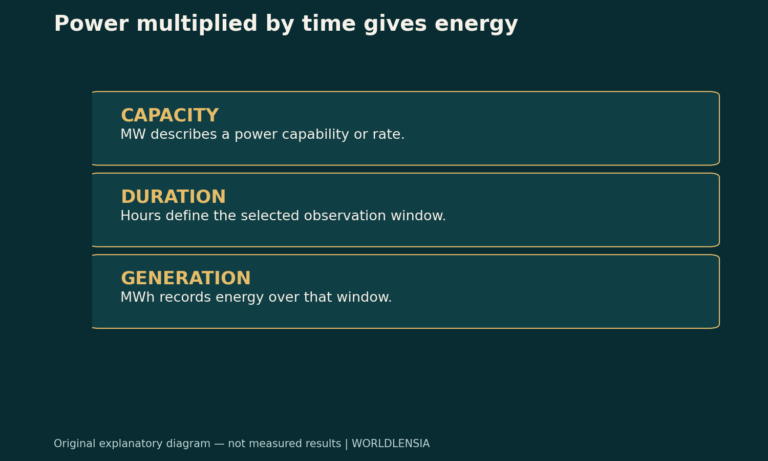
Compare electricity capacity and generation using the right units, observation periods and a clearly labeled capacity-factor example.
Read the article → October 19, 2026 · Countries & Cities
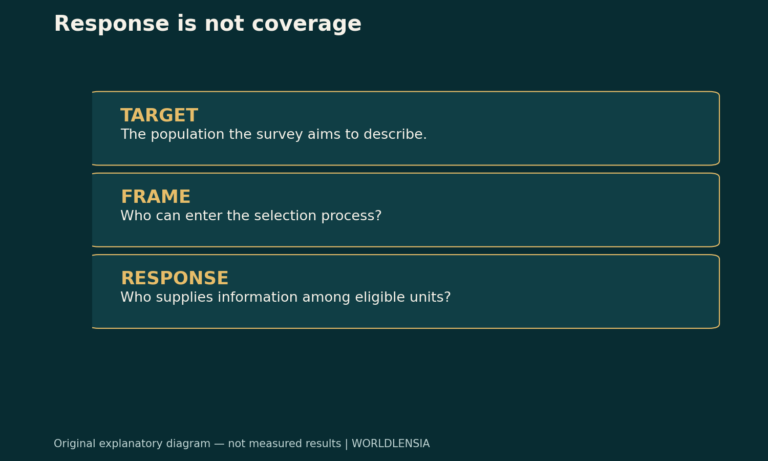
Separate survey response from population coverage and learn what a strong participation rate can—and cannot—tell you about a dataset.
Read the article → October 19, 2026 · Countries & Cities
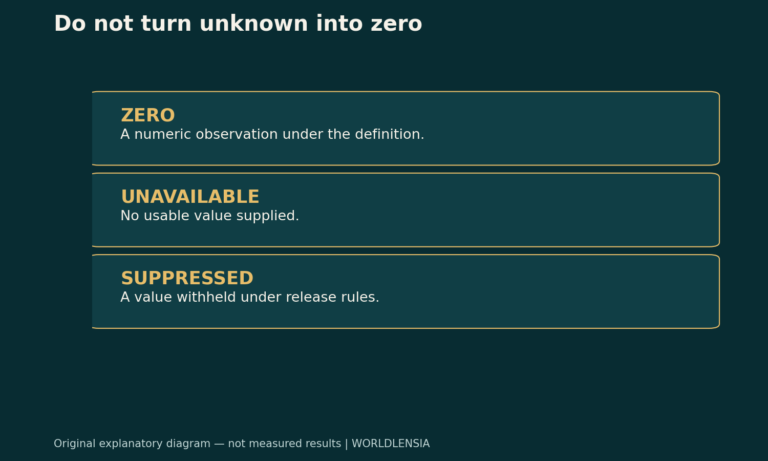
Keep missing and suppressed values separate from zero when reading public datasets, with a practical example for tables and charts.
Read the article →