

A survey response rate measures participation among the units contacted or eligible under a defined method; it does not prove that the survey reached the full target population. Response and coverage describe different parts of the measurement process. Treating a strong response rate as proof of complete representation skips the question of who had a chance to be selected.
This distinction matters when comparing places or evaluating a public dataset. A percentage can be carefully calculated and still answer a narrower question than the reader assumes. Begin with the population, the sampling frame and the eligible sample before interpreting the headline participation figure.
Survey response rate and population coverage are different
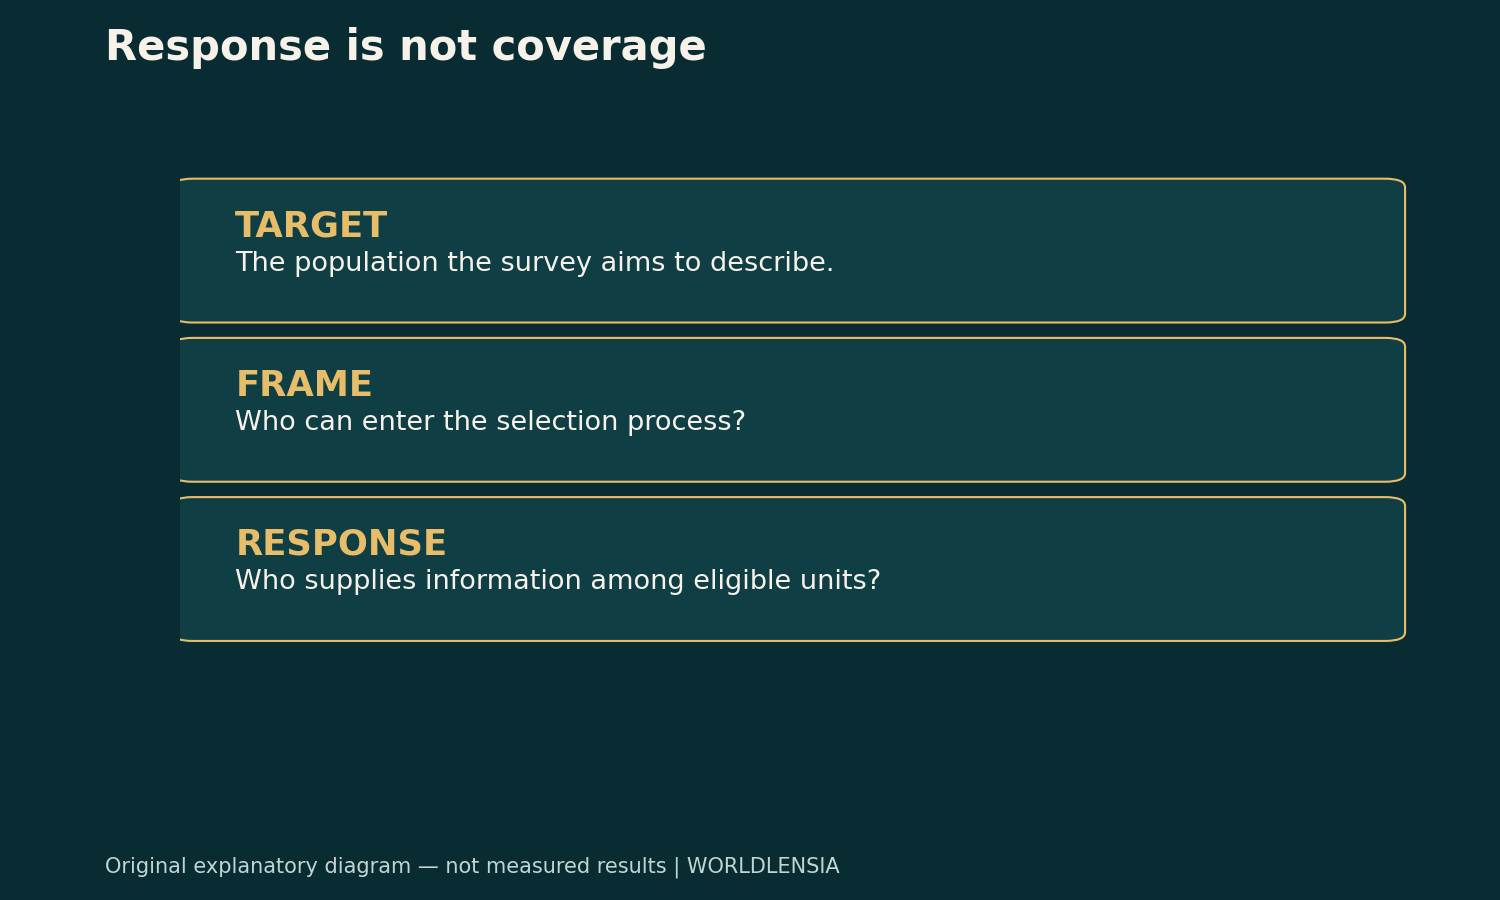
The target population is the group the survey aims to describe. A sampling frame provides the units or structure used for selection. The selected sample is the portion chosen under the survey design. Eligible respondents then supply information through the collection process.
Errors can arise at more than one boundary. A household missing from the frame cannot fix that omission by responding promptly: it was never selected through the intended process. A household in the sample that does not respond raises a different problem.
The Census Bureau's ACS definitions distinguish coverage error from unit nonresponse. Its response-rate documentation also explains why survey design and weights matter. These definitions are the methodological foundation; the simple fractions below are only teaching examples.
A fictional frame with an omitted area
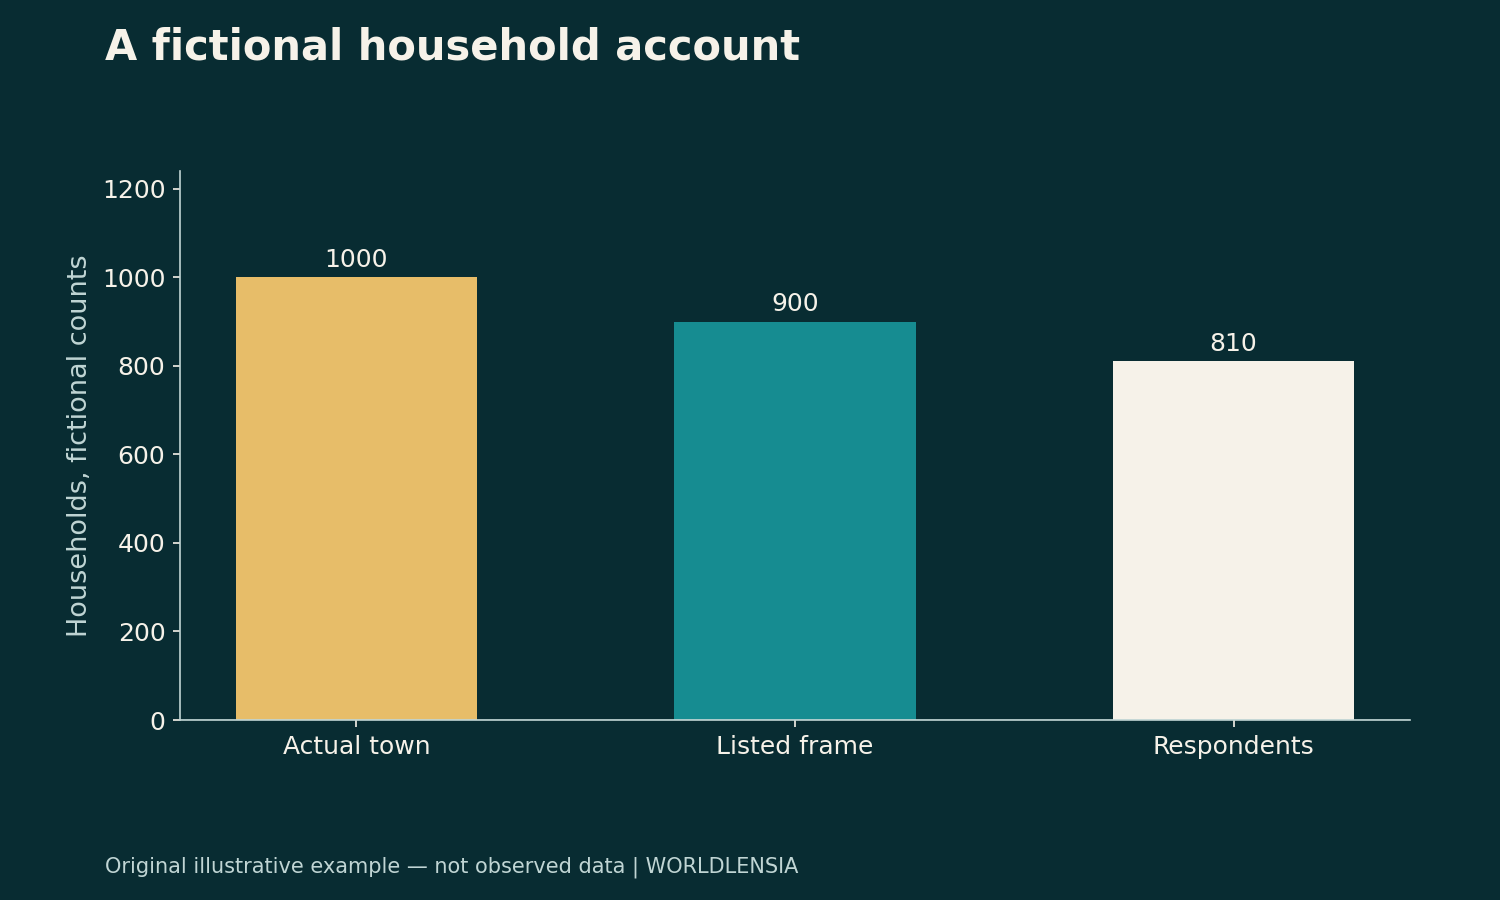
Imagine a town that actually contains 1,000 eligible households. A fictional survey frame lists 900 of them but omits a separate area containing 100. For simplicity, suppose all 900 listed households are approached and 810 respond.
The simple response fraction among the listed households is 810÷900=90%. That calculation describes participation within the fictional eligible frame. It does not establish that 90% of all 1,000 households answered, nor does it describe the missing area's characteristics.
| Stage in the fictional account | Households |
|---|---|
| Actual eligible town population | 1,000 |
| Listed in the frame | 900 |
| Omitted from the frame | 100 |
| Responded among those listed | 810 |
The observed respondents are 81% of the actual household count in this simplified census-like example. That second fraction is useful for exposing the omission. It is not the official ACS coverage estimator or a replacement for survey-specific quality measures.
High response can coexist with biased coverage
Suppose the omitted area has different housing costs from the included area. A very high response rate among included households does not supply the missing housing-cost information. Whether the resulting town estimate is distorted depends on the omitted group's size, characteristics and the estimation method.
Do not conclude automatically that every coverage gap creates a large bias. The gap is a reason to investigate. The direction and size of its effect require evidence; they cannot be read from the response percentage alone.
The same caution works in reverse. A lower response rate does not by itself quantify the error in a particular estimate. Nonresponse adjustment, auxiliary information and the relationship between participation and the variable of interest all matter. Quality assessment needs more than ranking surveys by one percentage.
Coverage includes more than omission
Undercoverage concerns eligible units or people without the intended chance of selection. Overcoverage can arise when units are duplicated or included when they should not be. Both affect the relationship between the frame and the population.
For a practical audit, ask how addresses, people or organizations enter the frame. Check whether the design can miss new construction, mobile populations or another relevant group, but do not assume a particular program has that failure without evidence. Read the publisher's documentation about how it maintains and checks coverage.
Keep the population definition explicit. A survey of households may intentionally exclude some living arrangements. That can be a defined scope rather than a processing error. Problems arise when an analyst generalizes beyond that scope without stating it.
Why weights complicate the simple fraction
Official surveys can select units with different probabilities and use follow-up designs that affect how response measures are calculated. An unweighted count of completed interviews divided by invitations may not reproduce the official response rate.
If you report an agency's weighted rate, identify it as the agency defines it. If you compute an informal participation measure, label the denominator and do not present it as the official statistic. The arithmetic can be correct while the name is wrong.
For comparisons across years, check whether collection modes, eligibility rules or sampling methods changed. A shift in the reported percentage may partly reflect the design rather than a change in public willingness to participate.
Add uncertainty and geography as separate checks
Coverage and response are not the same as sampling uncertainty. A published estimate may include a margin of error describing variability under the survey design, while coverage and nonresponse remain additional quality considerations.
The ACS margins-of-error guide helps interpret uncertainty around available estimates. The city-versus-metro guide addresses whether two numbers describe compatible geographic populations. A strong comparison needs all these checks rather than choosing one to stand in for the rest.
Build a quality note readers can use
Record the target population, frame, selection method, response definition, weighting basis and known coverage limitations. Identify the period and whether the figures refer to people, households or another unit. Keep factual source statements separate from your own concerns or hypotheses.
A clear conclusion might say that a survey achieved a stated response rate among eligible sampled units while its documentation identifies a particular population scope. That preserves the achievement without turning it into an unsupported claim of perfect representation.
A response dashboard should not collapse every quality field
If a public dashboard shows a response percentage, link it to the definition and retain separate fields for coverage limitations and estimate uncertainty. A single green status label can conceal whether the check concerns participation, representation or precision.
For a comparison article, explain which quality dimensions were actually verified. If only the response-rate definition was checked, do not imply that the frame was independently audited. The status of the evidence should be as clear as the statistic itself.
This is particularly useful when reusing a dataset in a new context. A survey designed for one target population may be carefully executed while still being unsuitable for a broader claim the analyst wants to make.
Preserve eligibility changes
If the survey changes who qualifies for an interview, compare the old and new definitions before interpreting a response-rate movement. An apparently small rule change can alter which units enter the denominator. Record that change beside the trend rather than leaving readers to assume constant eligibility.
Sources and methodology
Definitions were checked against the Census Bureau's ACS Response Rates Definitions and Coverage Rates Definitions on October 19, 2026. The coverage page displays a December 8, 2022 revision date; the response page's update date was not established. The town and all counts are fictional, and the unweighted fractions are not ACS estimates.
To retain sampling uncertainty and missing-value classifications, see ACS Margins of Error: When a City Ranking Is Too Precise and Missing, Suppressed and Zero: Three Different Public-Data States.