
Net migration is the difference between people moving into and out of an area under a dataset’s definitions. Total population change also reflects births, deaths and any other adjustments included in the population accounting method.
A place can therefore gain residents through migration while its total population falls. It can also experience substantial movement in both directions while recording little net migration. These outcomes describe different parts of the demographic picture.
Separate the stock from the flows
Population at a stated date is a stock. Births, deaths and migration over an interval are flows. The Census Bureau’s state and county glossary describes a component-of-change approach using natural change and net migration. [1]
Geographic mobility statistics can come from surveys with their own questions, universes and reference periods. Census user notes document changes and qualifications in the CPS mobility series. [2] A count of people reporting a different residence one year ago should not automatically be treated as identical to every migration component in a population-estimates model.
The first task is to identify which source and concept a headline uses. “People moving,” “net migration” and “population growth” are not three names for one number.
Reconcile a fictional population balance
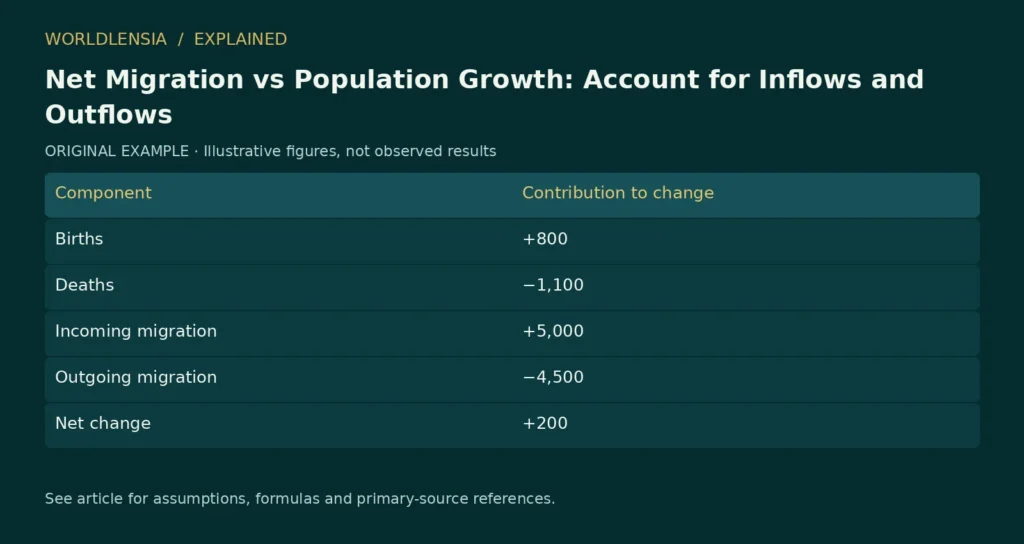
Suppose an area begins a year with 100,000 residents. During the year, it records 800 births, 1,100 deaths, 5,000 incoming residents and 4,500 outgoing residents. Ignore other adjustments for this teaching example.
| Component | Contribution to change |
|---|---|
| Births | +800 |
| Deaths | −1,100 |
| Incoming migration | +5,000 |
| Outgoing migration | −4,500 |
| Net change | +200 |
Natural change is 800 − 1,100 = −300. Net migration is 5,000 − 4,500 = +500. Combined, they produce a population gain of 200, ending at 100,200.
The fictional area’s net migration rate is 500 divided by an appropriate population denominator for the chosen method. Do not silently select the starting population when an official source uses a different denominator. State the method if calculating your own rate.
A small net figure can conceal large movement
The migration balance of +500 does not mean only 500 people moved. In this example, inflows and outflows total 9,500 moves across the boundary. The balance describes their difference.
Another fictional area might have 600 arrivals and 100 departures, also producing net migration of +500. The two areas have the same net balance but very different levels of movement. Housing turnover, school transitions and service demand may be affected differently.
Even gross-flow counts need clear definitions. Some datasets measure people whose residence differs between two dates, rather than every move made during the interval. A person who moves twice and returns to the original area may be represented differently depending on the source.
Keep domestic and international components visible
An area’s total net migration may combine domestic and international movement. One component can offset the other. A total near zero does not establish that neither type of movement occurred.
For subnational areas, a move between two domestic places is an outflow for one and an inflow for the other. At the national level, that internal movement does not change the country’s total population. The geographic boundary determines the meaning of the flow.
Our guide to city and metro boundaries explains why the same household relocation can have different implications for a city, county or metropolitan area. A move to a nearby suburb can reduce a city’s population without leaving the wider metro area.
Avoid inferring motives from a balance
A positive net flow does not by itself prove that a tax policy, employment program or marketing campaign attracted the new residents. People move for many reasons, and the balance combines multiple groups.
To investigate motives, use appropriate survey evidence or a research design that addresses competing explanations. A simple before-and-after migration chart can describe timing without establishing causation.
Likewise, population growth alone does not demonstrate that every resident is better off. It says nothing directly about housing affordability, service quality or income distribution. Those questions require their own evidence.
Present a transparent local comparison
For each place, report the boundary, interval, source, population denominator and whether the figures are estimates or counts from another process. Include natural change and migration components where available.
If components do not sum exactly to the displayed population change, read the source notes for adjustments and rounding before declaring an error. A model can include terms omitted from a simplified chart.
The strongest summary names what changed and how the pieces fit together. It lets readers see whether growth came mainly from migration, natural change or a combination, while preserving the difference between a balance, the underlying movement and the number of residents at a date.
Compare equal balances with different population sizes
A fictional town with net migration of 500 and population of 10,000 has a much larger proportional migration balance than a city with the same net migration and population of 1,000,000. Using the stated population as a simple illustrative denominator gives 5% and 0.05%, respectively.
These figures are not official migration rates. They show why a count and a rate answer different questions. The same additional number of residents can have different proportional significance, while the absolute number still matters for some service and housing decisions.
If a ranking uses a percentage, report the underlying count as well. A large percentage based on a small population can look dramatic. If it uses counts, include population context so the largest places do not appear to have the strongest proportional growth merely because they are large.
For official comparisons, use the provider’s denominator and interval. A rate calculated over five years should not be placed beside a one-year rate without a justified conversion and clear labeling.
A final source check should distinguish estimates of people from estimates of households and moving transactions. One household move can involve several people, and one person can move more than once. If the source counts a different unit, do not relabel it as residents without a supported conversion. State the original unit and explain which question it answers.
Sources and method
- Census state and county terms. Living glossary; publication date not established. Checked October 20, 2026.
- Census geographic mobility user notes. Living notes; individual notes have separate dates. Checked October 20, 2026.
Numerical teaching examples are original and illustrative unless explicitly identified otherwise. No hands-on product testing or individual medical assessment is claimed.
To separate population components from pace and density, see Fastest-Growing U.S. Cities in 2025: Percentage vs. Population Gains and Population Density: Why a City Average Can Hide How People Actually Live.