
An annualized quarterly growth rate shows the change that would occur if one quarter’s pace continued for four quarters. It is a way to express a pace on an annual scale, not a forecast that the same growth will actually occur for the next year.
Confusion arises because headlines often shorten several different comparisons to “annual growth.” Quarter-to-quarter growth, its annualized equivalent, growth from the same quarter a year earlier and growth in the annual average all use different calculations.
Start with the quarterly ratio
BEA explains that its annualized quarterly percentage changes compound the quarterly rate for four quarters. [1] Its GDP learning materials provide the broader context for understanding the measure of national output. [2]
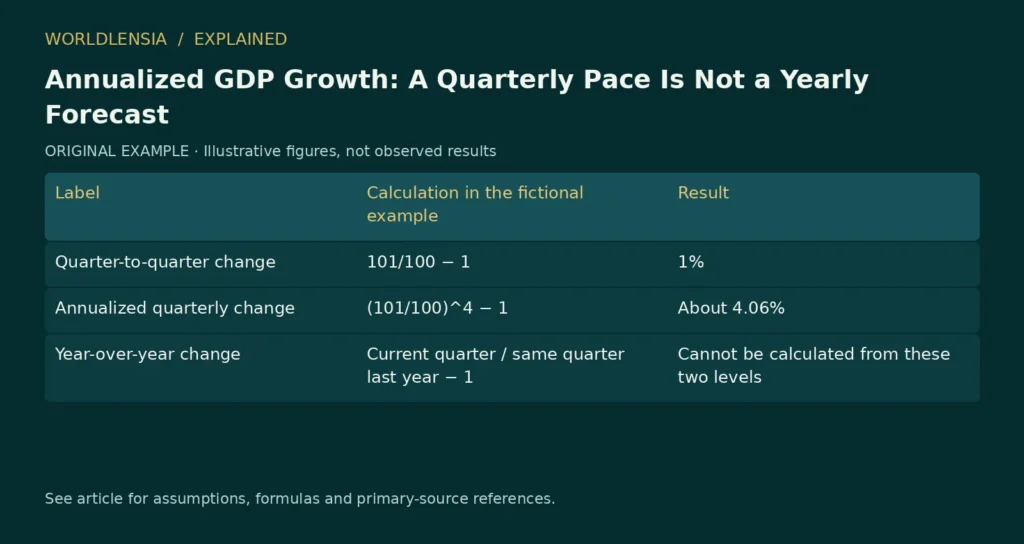
In a fictional real-output series, the level rises from 100 in the first quarter to 101 in the second. Quarter-to-quarter growth is 101 / 100 − 1 = 1%.
Annualizing that pace gives (101 / 100)^4 − 1. The result is 4.060401%, or about 4.1% when rounded to one decimal place. Multiplying 1% by four gives a close approximation here, but compounding gives the exact conversion.
| Label | Calculation in the fictional example | Result |
|---|---|---|
| Quarter-to-quarter change | 101/100 − 1 | 1% |
| Annualized quarterly change | (101/100)^4 − 1 | About 4.06% |
| Year-over-year change | Current quarter / same quarter last year − 1 | Cannot be calculated from these two levels |
The last row is important. Two adjacent quarters do not provide the year-earlier observation needed for a year-over-year comparison.
Convert the rate back when necessary
Suppose a report gives an annualized quarterly rate of 4%. The underlying quarterly factor is 1.04 raised to the power of one quarter. Subtracting one produces approximately 0.985%, rather than exactly 1%.
When comparing countries, first check whether their quarterly growth headlines are annualized. A 1% unannualized quarterly rise and a roughly 4.1% annualized rise can describe the same pace. Treating them as competing results exaggerates the difference.
Do not convert every percentage in an economic release using this formula. The data provider may publish some volatile series at quarterly rates or use different conventions. Read the table’s labels and methodological notes before transforming anything.
A pace can change sharply between quarters
Imagine a fictional series moving from 100 to 101 and then remaining at 101 for the next three quarters. The first increase has a 4.06% annualized pace, but the full change from the starting level to the final level is only 1%.
There is no contradiction. The annualized calculation asked a conditional question about repeating the first quarter’s pace. The later observations show that the condition did not occur.
A negative quarter works the same way. If output falls by 1%, the annualized change is 0.99^4 − 1, approximately −3.94%. It is not exactly −4%, and a later rebound is a separate observation.
Year-over-year growth carries a different history
A same-quarter-year-earlier comparison incorporates the changes across four quarters. It can remain positive after a recent decline if earlier gains were large enough. Conversely, it can remain weak after a recent improvement.
This makes the two measures complementary. The latest quarterly pace emphasizes recent movement, while the year-over-year comparison reflects a longer interval. Neither should be silently substituted for the other in a chart or headline.
Annual-average growth has another timing effect because it compares the average level across all quarters of one year with the average across the previous year. To reproduce it, use the relevant annual series or all required quarterly observations and the agency’s method.
Keep revisions and units visible
Use levels from the same data release when reproducing a growth rate. Mixing a revised current quarter with an unrevised preceding quarter can produce a rate that appears in neither official release. Our guide to GDP data vintages explains this version-control issue.
Also distinguish an annualized growth rate from a level expressed at an annual rate. They are related reporting conventions, but they describe different objects. The percentage formula uses a ratio of comparable levels; it should not lead you to multiply an already annual-rate level again.
A careful explanation names the comparison and states the conditional meaning. “Output rose 1% from the previous quarter, equivalent to a 4.1% annualized pace” lets readers understand the result without mistaking a standardized rate for a prediction.
Sources and method
- BEA annual-rate FAQ. January 13, 2006; modified April 24, 2018. Checked October 20, 2026.
- BEA GDP learning guide. Living guide; publication date not established. Checked October 20, 2026.
Numerical teaching examples are original and illustrative unless explicitly identified otherwise. No hands-on product testing or individual medical assessment is claimed.
To keep annualization separate from calendar adjustment and revisions, see Seasonally Adjusted vs Unadjusted Data: Which Should You Use?.