

GDP revisions update estimates for the same observation period as new information or methods become available. A revision is not another quarter of economic activity added to the first report. It is not another quarter of economic activity added to the first report. To understand the change, keep the period being measured separate from the date on which the estimate was released.
That separation is the idea behind a data vintage. A vintage records what a particular release said about one or more periods. When analysts mix values from different vintages without explanation, they can create a growth comparison that no single release actually reported.
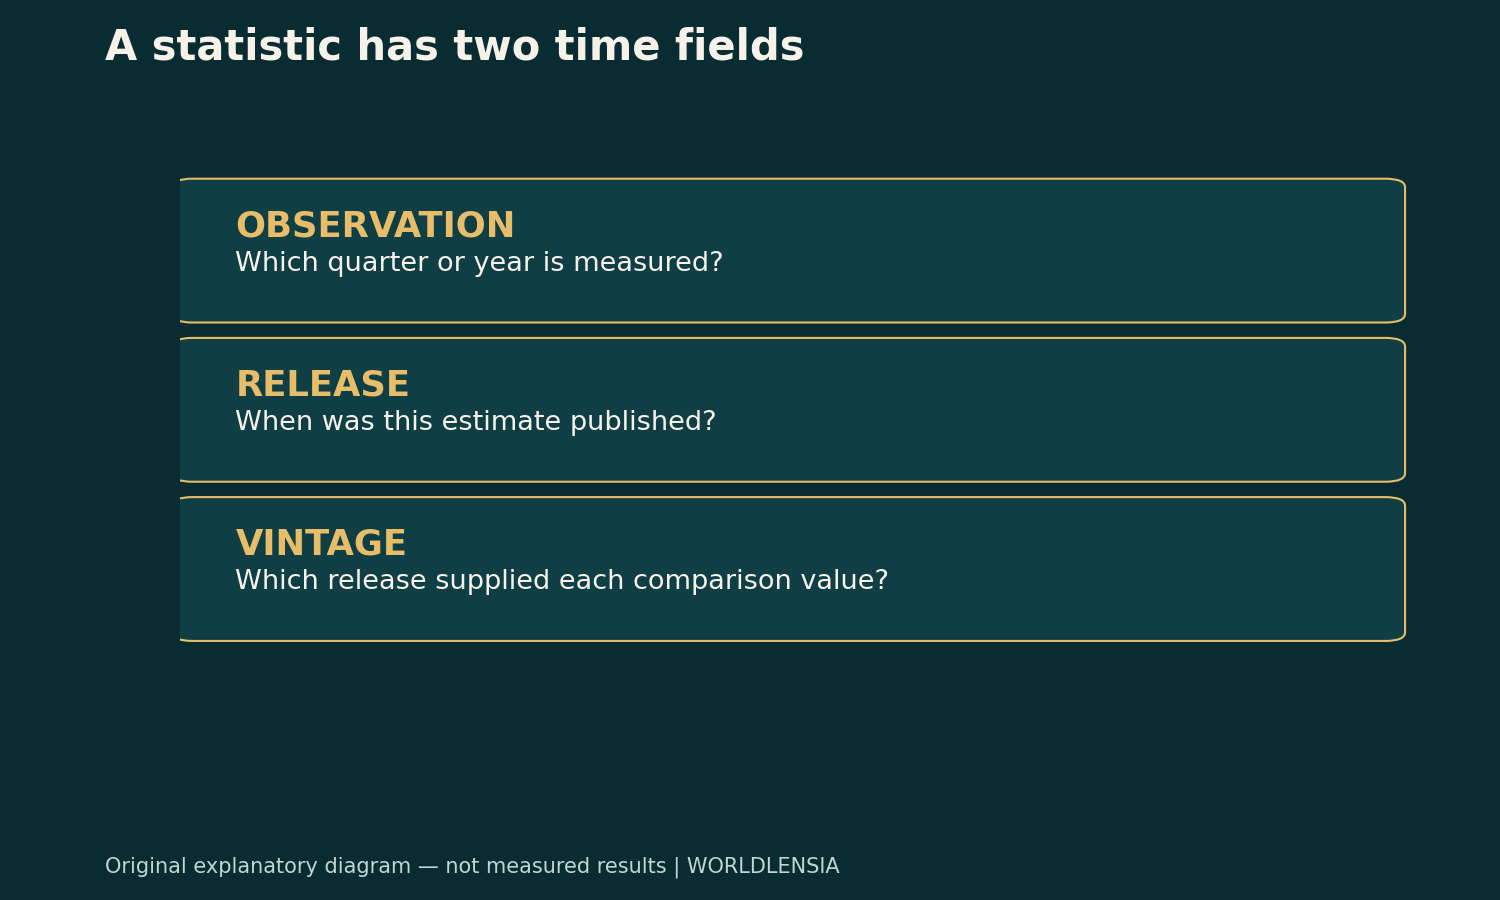
GDP revisions: Observation and publication times differ
The observation period identifies the activity a statistic aims to measure. The publication date identifies when an estimate became available. A later release can revise earlier periods as well as report a new one.
Store both dates. A dataset with only a quarter label may be enough to draw a current revised history, but it is not enough to reconstruct what an observer knew at an earlier decision date. That historical question requires release records.
BEA's NIPA methods describe the sources and estimation framework used in the national accounts. The handbook is a living reference with chapter-specific dates and limitations. Use it to understand the concept of evolving information, then read the release-specific notes for an actual revision.
A synthetic two-release matrix
Imagine two fictional quarters, Q1 and Q2. Release A estimates their levels at 100 and 102. Release B later estimates Q1 at 101 and Q2 at 102.5. The units and definitions are held constant for this illustration.
| Synthetic vintage | Q1 level | Q2 level | Q2 growth from Q1 |
|---|---|---|---|
| Release A | 100 | 102 | 2.00% |
| Release B | 101 | 102.5 | About 1.49% |
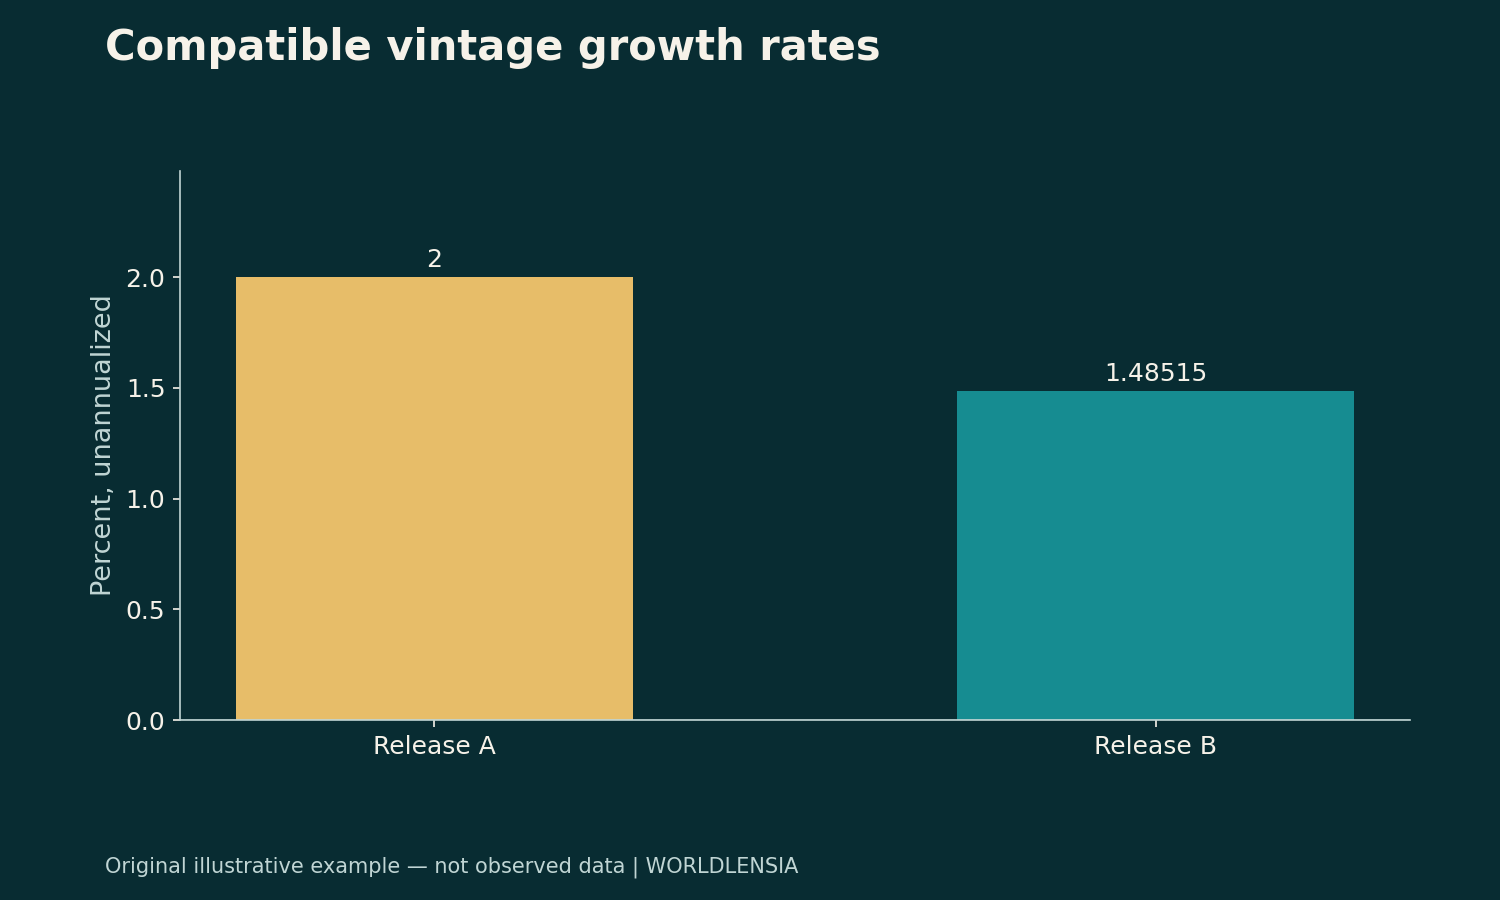
For release A, 102÷100−1=2%. For release B, 102.5÷101−1 is approximately 1.485%. The later release raises both levels, but the growth rate is lower because the relative change between them is smaller.
These values are invented. They do not describe an actual BEA release. Their purpose is to demonstrate why “the level was revised up” and “the growth rate was revised down” can both be true.
The mixed-vintage mistake
Now divide release B's Q2 value, 102.5, by release A's Q1 value, 100. The calculation gives 2.5% growth. That number is arithmetically correct for the selected inputs, but neither internally consistent release comparison produces it.
The mistake can occur when a charting file is updated only partially, when one value comes from a saved article and another from a current download, or when an analyst copies a historical base from memory. A plausible-looking rate does not reveal the mismatch.
Prevent it by retaining the vintage with each observation. When using the latest history, update the full comparison window from the same compatible release. When comparing what was known at two dates, label the vintages and explain the purpose rather than blending them.
Why early estimates can change
Publishing timely estimates means working with information available at the time. Later data can replace preliminary inputs or provide additional detail. Methodological changes and broader updates can also affect the historical series.
Those general mechanisms do not explain every specific revision. For a real release, identify the source note that describes what changed. Do not attribute a movement to a particular industry or component merely because it is a plausible source of revisions.
Keep the evidence level clear. “Later source information was incorporated” may be supported by a release note. “The original survey overstated consumer demand” is a more specific claim and needs more specific evidence.
A revision is not automatically a mistake or concealment
An estimate can be revised as part of a stated statistical process without implying misconduct. Conversely, calling a revision routine does not mean its size or consequences are unimportant. The right response is to examine the method, the new information and the effect on the comparison.
Use neutral wording until the evidence supports a stronger conclusion. State the old value, the revised value, the observation period and the release dates. Distinguish a correction of an identified error from an update that incorporates more complete data.
Readers benefit from knowing whether the narrative changes. A revision may leave the broad interpretation intact, or it may materially alter the apparent direction or magnitude. Explain that consequence without exaggerating the certainty of the updated estimate.
Annualization adds another transformation
GDP reports can present changes on an annualized basis. A quarter-to-quarter change and an annualized quarterly growth rate are different transformations. Do not compare them as if they share the same scale.
For an actual calculation, use the publisher's stated formula and the compatible underlying values. Record whether the result is annualized, a year-over-year change or a change between annual totals. A revision can affect each comparison differently.
The synthetic matrix above uses a simple unannualized ratio so the vintage effect is isolated. It is not presented as a complete reproduction of the official GDP estimation or annualization process.
Current-dollar and real measures need separate labels
A revision discussion can also become confused when nominal and inflation-adjusted values are mixed. The nominal-versus-real GDP guide explains the price/output distinction. A vintage comparison should keep the selected basis consistent.
Population-adjusted measures introduce another series. For GDP per capita, a revised population estimate can affect the ratio as well as a revised output estimate. Record the sources and vintages of both components.
Do not assume that matching observation years makes all inputs compatible. The definitions, adjustment basis and release history still matter.
Reconstructing what was known at a date
Suppose the question is whether a published commentary accurately described the evidence available when it was written. The latest revised series alone cannot answer that. You need the release available at the time and the exact statistic the commentary used.
Preserve a dated source copy or official release archive, then record later revisions separately. Do not judge an earlier sentence as though it had access to later data unless the sentence claimed knowledge beyond what was available.
The reverse problem also matters. An old observation quoted in a new article should not be presented as the latest estimate merely because it was once accurate. Check whether the relevant series has been updated and identify the vintage used.
Build a reproducible comparison file
A useful file has fields for series identifier, observation period, value, unit, adjustment status, release date and source location. Keep raw downloads separate from calculated fields. Add a note for each transformation, such as percentage change or rebasing.
If a new release changes historical observations, retain both versions rather than silently overwriting the earlier record. This permits a revision matrix and makes it easier to explain why an article or chart changed.
When publishing a chart, state whether it uses the latest revised history or an earlier real-time vintage. Both can be legitimate choices for different questions. The problem is leaving readers unable to tell which one they are seeing.
Write the revised result clearly
For the fictional matrix, an accurate summary says that release B raises the estimated levels of both quarters while reducing Q2's unannualized growth from 2% to about 1.49%. The sentence names the comparison rather than saying only “GDP was revised higher.”
For real data, include the relevant release dates and observation periods, and cite the official note explaining material changes. Avoid a forecast or causal story that the revision table does not establish.
The core habit is simple but powerful: treat a statistic as a value attached to a definition, period and release. That record prevents a later update from becoming an accidental new claim about what happened or what people knew earlier.
Compare the revision in the right unit
In the synthetic matrix, release B raises Q2's level from 102 to 102.5, an increase of 0.5 level units. It changes the calculated Q2 growth rate from 2% to about 1.49%, a decline of roughly 0.51 percentage points. Those are two different descriptions of the same update.
Do not call the growth revision “down 0.51%” unless a relative percentage change in the growth rate is actually intended and calculated. Name percentage points when subtracting two percentages. Clear units prevent an already complex vintage comparison from acquiring an avoidable language error.
A revision chart needs a stable observation target
One useful chart follows the estimate for a single quarter across successive release dates. Another shows the latest estimate for many quarters. The horizontal axes and questions differ: publication history in the first, economic observation time in the second.
Do not combine them without explaining the design. A point on a revision-history line does not represent a new quarter of output. A point on the latest-history line does not show what was known at that point in the past.
Labeling both axes and preserving the vintage field makes either chart useful. The reader can then see whether the article is about the economy's path or the measurement history of one part of that path.
Keep the initial headline in context
When updating an article after a release revision, add a dated explanation if the change materially affects its interpretation. State which period and measure changed rather than replacing numbers in a way that obscures the earlier evidence.
An update note does not need to imply that the original report was careless. It can explain that the source estimate was revised and that the article now uses the later vintage. If the original article mixed incompatible inputs, that is a different issue and should be corrected as such.
Sources and methodology
Estimation concepts were checked against BEA's NIPA Handbook, Chapter 4 and its handbook landing page on October 19, 2026. The landing page lists Chapter 4 as December 2023 and notes limits on incorporation of later updates. The matrix and all calculations are original synthetic examples, not a current GDP release, forecast or investment recommendation.
To keep revisions separate from seasonal adjustment and annualization, see Seasonally Adjusted vs Unadjusted Data: Which Should You Use? and Annualized GDP Growth: A Quarterly Pace Is Not a Yearly Forecast.