
An economy’s spending total can increase because it produces more, because prices rise, or because both happen together. Nominal and real GDP help separate these stories. The distinction is essential when reading a growth headline or comparing business performance with the wider economy.
At a glance
- Nominal values use prices from the period being measured.
- Real measures adjust for price changes.
- A growing money total does not by itself prove that output volume rose.
Start with the question
BEA distinguishes current-dollar estimates from inflation-adjusted measures and publishes price indexes alongside national accounts. The useful question is whether you are describing the value of transactions at current prices or changes in the volume of production. Those are related but different objects.
A nominal comparison is relevant to the size of money flows. A real comparison is more useful for discussing changes in output after accounting for prices. Neither automatically tells you how income was distributed or whether a typical household became better off.
A one-product economy
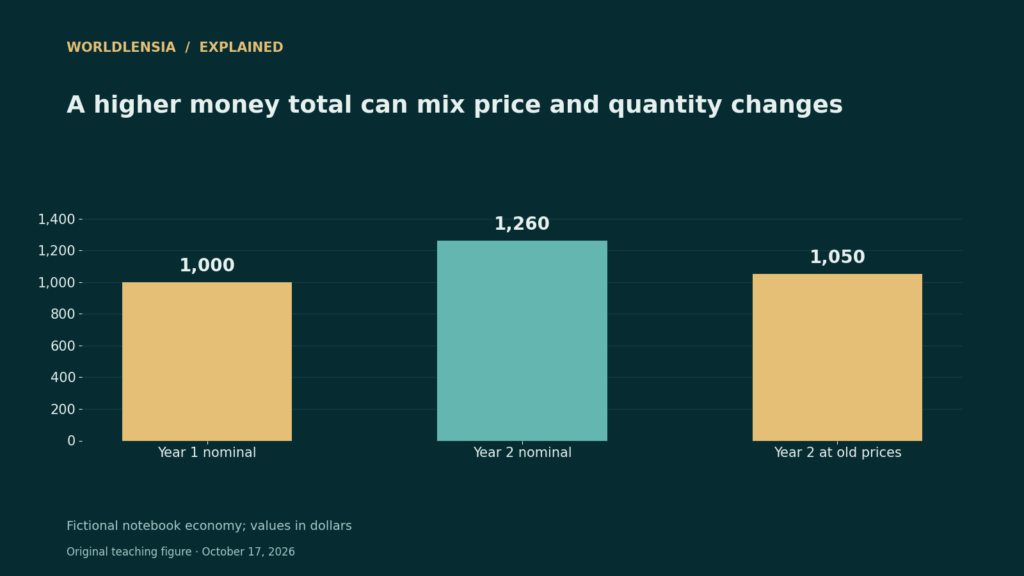
Imagine a fictional economy producing only notebooks. In year one, it makes 100 notebooks at $10 each, giving nominal output of $1,000. In year two, it makes 105 notebooks at $12 each, giving nominal output of $1,260. The money total rises 26%.
At the first year’s prices, the second year’s output is 105 multiplied by $10, or $1,050. In this simplified example, output volume rises 5%, while the notebook price rises 20%. Multiplying 1.05 by 1.20 gives 1.26; simply subtracting the two growth rates is not the exact calculation.
Why official GDP is more complicated
Real economies contain many goods and services, and relative prices change. Official real GDP uses more sophisticated methods than our fixed-price teaching example. Do not present the notebook arithmetic as a description of BEA’s complete calculation.
When comparing countries, also check population, currency conversion, and purchasing power. Total GDP and GDP per person answer different questions. A high total can coexist with a much lower average per resident, and an average does not describe every household.
A practical comparison
| Fictional notebook economy | Year one | Year two |
|---|---|---|
| Quantity | 100 | 105 |
| Price per notebook | $10 | $12 |
| Nominal value | $1,000 | $1,260 |
| Value at year-one prices | $1,000 | $1,050 |
Before using the result
- Identify current-dollar or real units.
- Match the period and revision vintage.
- Do not treat GDP growth as a direct measure of household wellbeing.
Continue exploring: our economy and finance coverage.
Connect the simple example to a real data table
The notebook example holds one product and its reference price fixed so readers can isolate quantity from price. When using an official GDP release, record the table, units, reference period and release vintage instead of applying that simplified construction to every component.
Our guide to chained-dollar GDP components explains why adding component levels can mislead. Our GDP-per-capita explainer addresses a different question: how a total relates to the population. Keep price adjustment, aggregation and per-person comparisons as separate steps.
Sources and methodology
Reviewed October 17, 2026. WorldLensia explanatory analysis. Worked examples and the accompanying teaching figure are illustrative, not measured findings or product tests. Consult the linked source for definitions and revisions.
To keep the growth transformation and component accounting explicit, see Annualized GDP Growth: A Quarterly Pace Is Not a Yearly Forecast.