
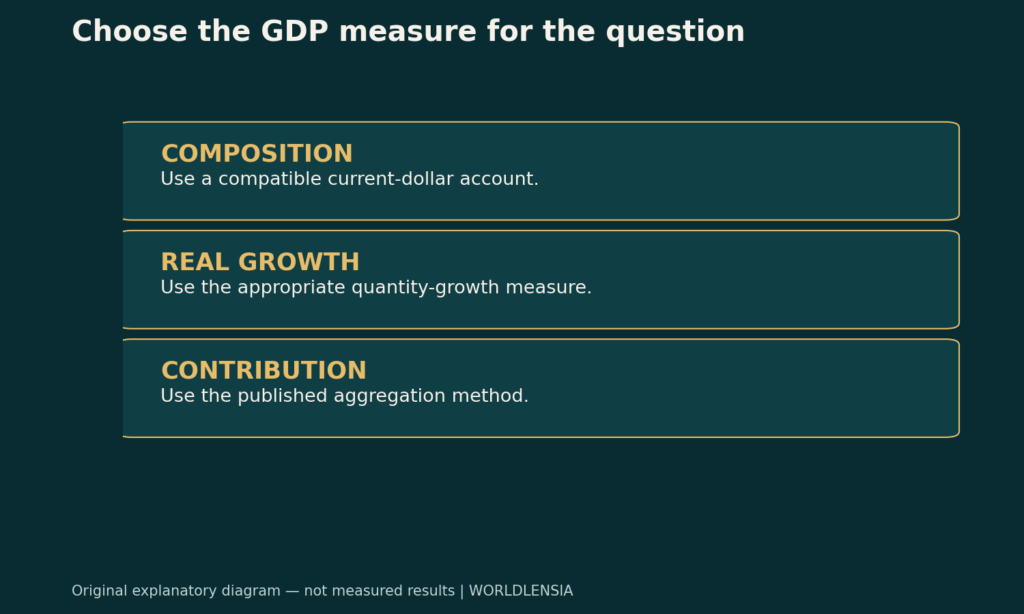
Chained-dollar GDP components can produce a total that differs from the published real GDP aggregate. That is not necessarily an arithmetic error. Chain-type measures do not use one fixed set of prices across the whole time series, so their component levels are not generally additive.
The consequence is practical. A component's chained-dollar value divided by total real GDP is not automatically a valid measure of its share, and changes in those component levels should not be improvised into contributions to total growth. Choose the published measure that matches the analytical question.
Begin with a simpler fixed-price account
For a single product, current-dollar value equals price multiplied by quantity. Across products, a nominal total adds the values measured in the same currency and period. This is a value account, not yet a separation of price and quantity changes.
A fixed-price teaching example holds one selected set of prices constant and changes quantities. That makes it easy to see how the chosen prices weight different products. It also exposes why a fixed base can become consequential when relative prices and quantities change.
The example below is deliberately not an implementation of BEA's chain-type estimator. Its role is to show why the choice of weights matters before discussing the warning attached to chained-dollar series.
Two fictional products with changing relative prices
Suppose period A contains ten units of product X priced at $10 and ten units of product Y priced at $10. Nominal value is $100+$100=$200.
In period B, X's quantity rises to twenty and its price falls to $5. Y's quantity stays at ten and its price rises to $20. Nominal value becomes $100+$200=$300.
| Synthetic product | A quantity | A price | B quantity | B price |
|---|---|---|---|---|
| X | 10 | $10 | 20 | $5 |
| Y | 10 | $10 | 10 | $20 |
Both prices and the quantity mix changed. The nominal increase from $200 to $300 cannot be interpreted as a pure increase in physical output. A price/quantity framework must specify how the products are weighted.
The selected fixed-price base changes the comparison
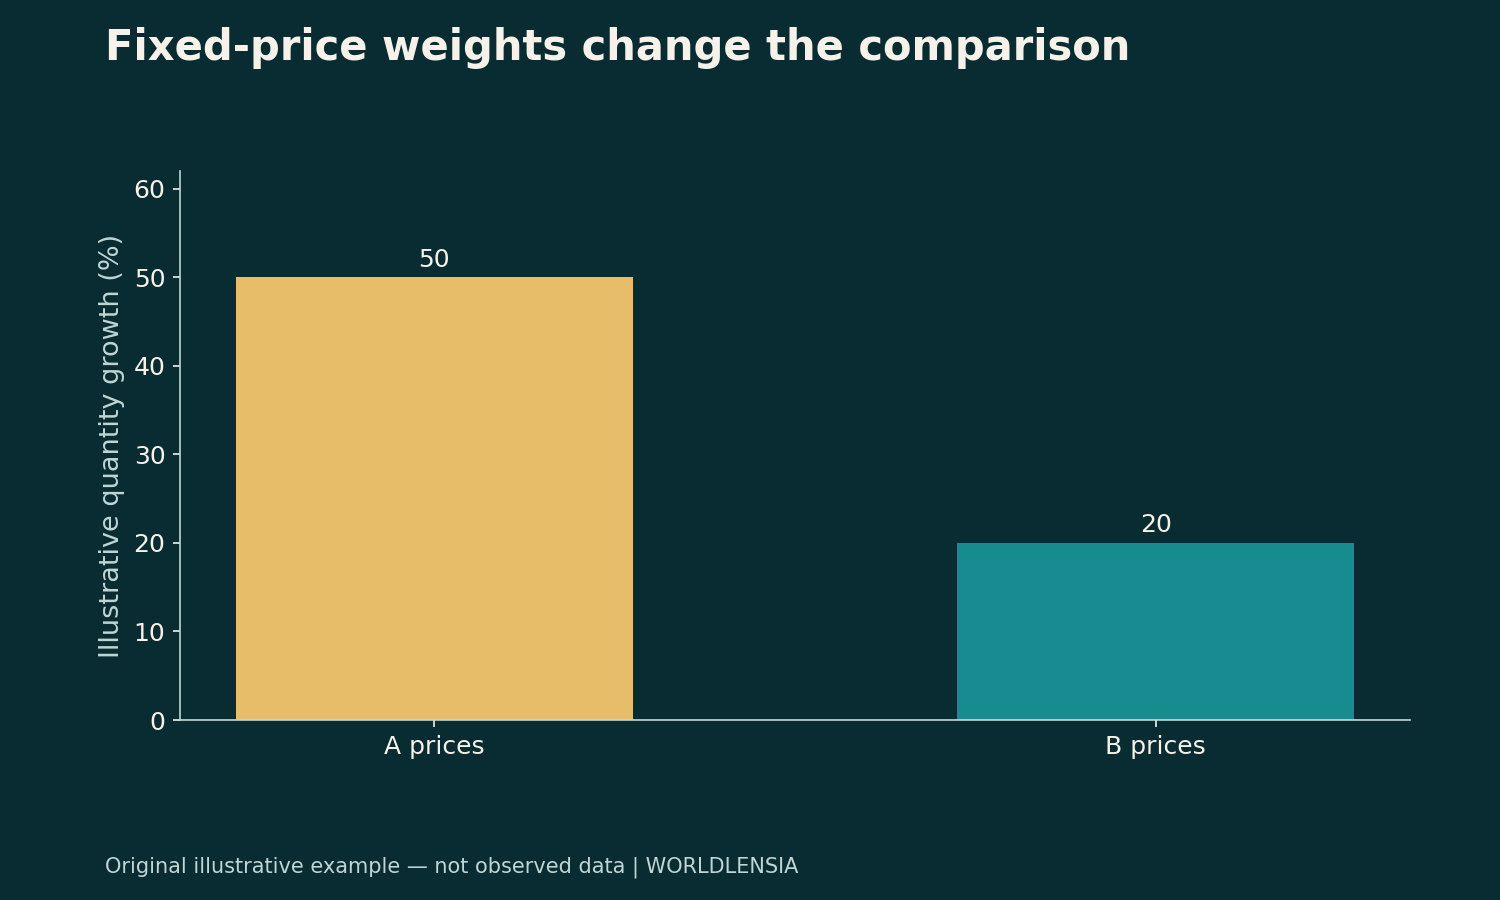
Value both periods at A's prices. A remains $200. B becomes twenty X units at $10 plus ten Y units at $10, or $300. Under that fixed-price account, the quantity comparison rises 50%.
Now value both periods at B's prices. A becomes ten X units at $5 plus ten Y units at $20, or $250. B is $300. Under that fixed-price account, the quantity comparison rises 20%.
The physical quantities are identical in both exercises. The different growth results arise because the selected prices give the products different weights. The example does not identify one fixed-price answer as the official GDP growth rate.
It establishes a narrower point: aggregating unlike products requires a weighting method, and that method matters when relative prices change.
Why chaining enters the discussion
Chain-type methods connect comparisons over time rather than keeping one distant set of fixed weights for every observation. The exact formula and implementation belong in the publisher's technical documentation.
BEA's NIPA Handbook explains that chained-dollar measures are not based on one single set of weights and are not additive. It also warns against using them directly to derive accurate component shares or contributions to growth. That is the methodological constraint this article asks readers to preserve.
Do not treat the fixed-price example as a shortcut for calculating a chain-type series. It illustrates the problem of weighting; it does not reproduce the official estimator, source inputs or revisions.
A reference scale does not restore additivity
Chained-dollar series are expressed on a reference scale, which can make them resemble ordinary currency amounts. That familiar appearance can tempt an analyst to add them as if they were current-dollar accounting entries.
The label does not change the aggregation method. A reference-period presentation does not mean that every component throughout the history is measured with one common fixed-price vector. The nonadditivity warning therefore remains relevant away from any special reference-period relationship.
Read the table notes instead of relying on the dollar symbol. A unit can be familiar while the transformation behind it requires different operations.
Three questions need different measures
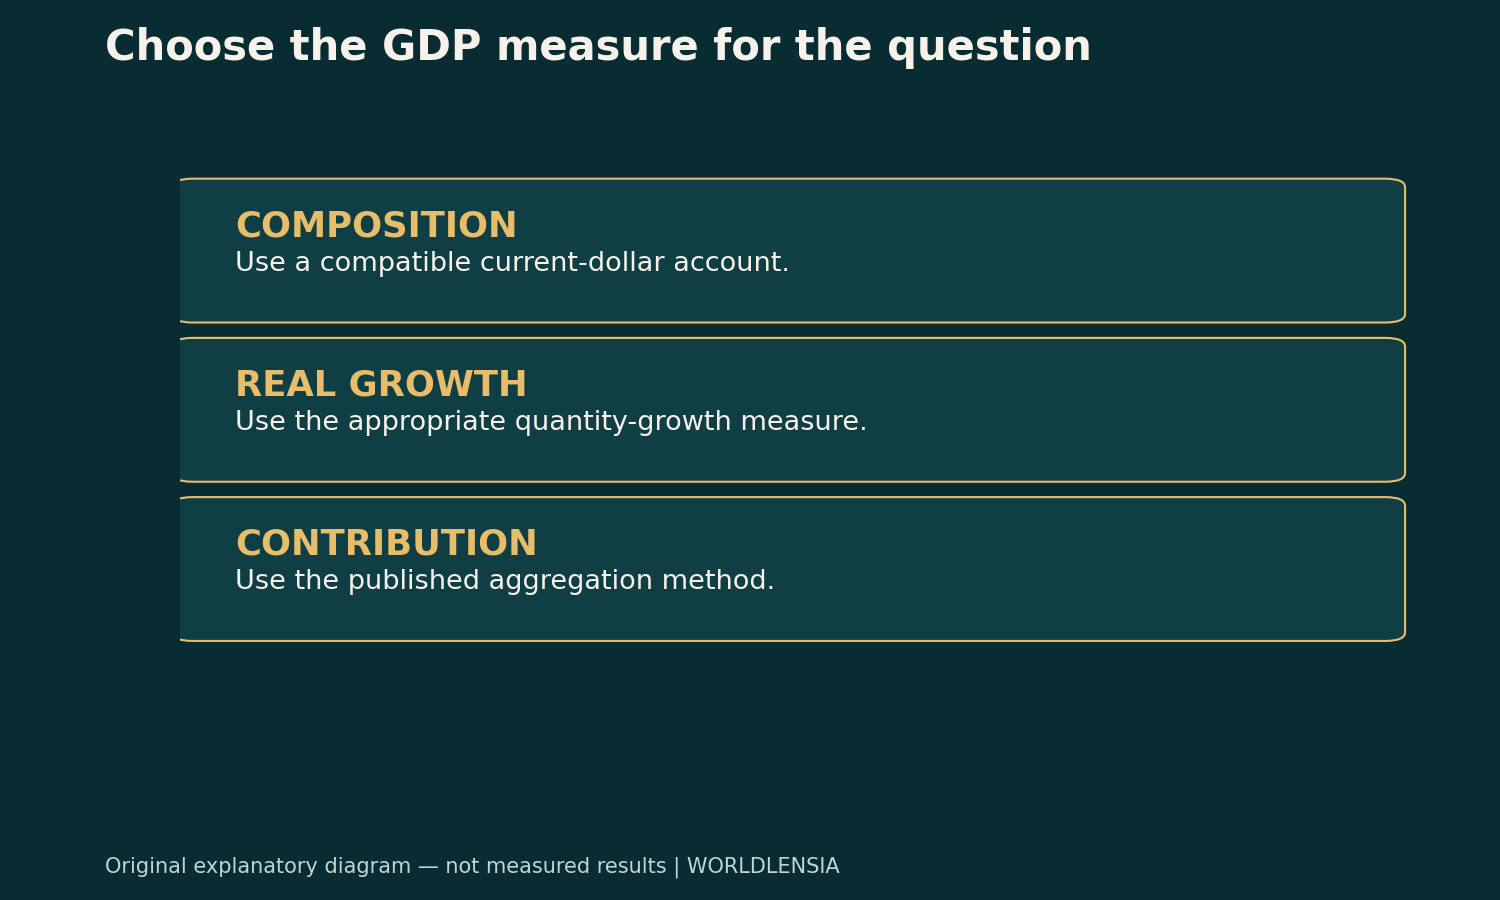
The first question is about current-dollar composition: how much of total current-dollar value belongs to a component under the defined account? A compatible nominal-share calculation can answer that kind of question.
The second concerns quantity growth: how did the real measure change over a selected interval? Use the appropriate real growth series and its definition.
The third concerns contribution: how much did a component contribute to the aggregate growth rate under the publisher's method? Use the published contribution-to-growth measure or a properly documented compatible calculation.
These are related questions, but changing the label on one ratio does not make it answer all three. A report should identify which one it is trying to answer before selecting columns from a table.
Imagine an analyst copies a chained-dollar component value and divides it by the chained-dollar aggregate. The resulting percentage may look like a familiar share. Without checking the method, however, it can be an invalid interpretation of nonadditive quantities.
The appropriate response is not to invent an adjustment factor so the shares sum to 100. That can hide the methodological mismatch. Return to the source and choose a compatible measure for the composition question.
If an analyst creates a custom allocation for a specific purpose, label it as that allocation and explain the method. Do not present it as an official component share merely because the final numbers add neatly.
Growth contributions are not raw level differences
A component's real level can rise while its contribution to the aggregate requires the publisher's weighting and aggregation framework to interpret. Subtracting two displayed chained-dollar levels and dividing by an aggregate level is not automatically the published contribution calculation.
Use the source's contribution tables when that is the question. Record the period and whether the reported growth is annualized or expressed on another basis. A percentage contribution and a percentage-point contribution should also be labeled correctly.
WorldLensia's percent-versus-percentage-point guide explains that language distinction. It cannot repair a wrong aggregation method, but it helps prevent a second error after the correct measure has been selected.
Revisions and chaining are separate issues
A series can change because source information is revised, because methods change or because a reference scale changes. Those are not the same operation as the general chain-type aggregation structure.
Save the release vintage and read the revision note. Do not explain every difference between two downloaded tables as nonadditivity. One file may use a different period, unit or release history.
Likewise, do not claim that a pure rebasing changes growth relationships when it simply multiplies a fixed series by one common factor. The transformation needs to be identified before its consequences can be described.
Keep the time comparison explicit
Quarter-to-quarter, year-over-year and annual comparisons can answer different questions. Some published GDP growth rates are annualized. A component and aggregate must use compatible periods and transformations before a contribution can be interpreted.
For a chart, write the comparison directly in the title or subtitle. “Contribution to annualized quarterly real GDP growth” conveys a different construction from “share of current-dollar GDP.” Avoid a generic “GDP by sector” heading when the measure is more specific.
If the available table does not support the intended comparison, change the chart or obtain the right source. A visually appealing stacked graphic is not a reason to force nonadditive values into a composition display.
A chart should follow the mathematics
Stacked area and stacked bar charts suggest that the pieces add to a total. That is appropriate only when the displayed measure actually supports that interpretation. Nonadditive chained-dollar components can therefore be a poor choice for an unlabeled composition stack.
A growth-rate comparison may be clearer as separate lines or small panels. A contribution chart should use compatible contribution figures. A nominal-composition chart should identify its current-dollar basis.
Do not solve a mathematical problem by hiding the axis labels. The chart's visual grammar communicates a relationship even when the caption is vague. Make the relationship accurate before polishing the presentation.
A small source-selection decision tree
If the question asks “How large is this component in current value?”, inspect the current-dollar account and compatible totals. If it asks “How did real activity change?”, inspect the appropriate real growth measure. If it asks “What drove aggregate growth?”, inspect contribution measures and the relevant method.
Then check the series identifier, observation period, adjustment status, units and release date. Record the source table and any warning about additivity. Keep transformations in a calculation log so another reader can reconstruct the result.
The nominal-versus-real GDP guide supplies the broader price/output distinction. This article adds the aggregation constraint: a real measure's interpretation is not determined only by the word “real.”
What the fictional example does and does not prove
The two-product account shows that fixed-price quantity comparisons can differ when the base prices differ. It demonstrates why weighting matters. It does not produce a current GDP estimate or show the numerical size of nonadditivity in an actual BEA table.
The nonadditivity statement comes from the official method documentation, not from treating the toy calculation as a full national-accounts model. Keeping those evidentiary roles separate prevents the example from claiming more than it demonstrates.
For an empirical article, obtain the actual table, its notes and the relevant release. If the goal is to quantify a discrepancy between component sums and the aggregate, calculate it transparently and explain that it reflects the measure's structure rather than automatically calling it missing output.
Avoid unnecessary precision
Displayed levels and contributions can be rounded. Small apparent differences may reflect that display precision as well as the underlying method. Use adequate precision for calculations and do not infer a substantive finding from a last decimal place without checking the unrounded source.
When reporting a material result, distinguish an exact accounting relationship from an estimate. National accounts combine many sources and methods; a long decimal expansion does not make every input equally certain.
The reporting goal is reproducibility and interpretability, not the maximum number of digits. State the convention and keep the detail needed for the reader's question.
A useful conclusion for readers
Chained-dollar GDP components do not generally behave like a set of ordinary amounts that can be stacked into an exact real total. The aggregation method determines which operations are valid. Use nominal shares for a compatible current-value composition question and published real growth or contribution measures for their corresponding questions.
The essential habit is to read the unit and the method together. A number expressed in dollars can still require more care than adding, dividing and relabeling the result.
A two-stage worksheet prevents accidental substitution
First create a source-selection sheet with the analytical question and the official measure chosen to answer it. Then create a calculation sheet that records only transformations valid for that measure. This separates a conceptual choice from spreadsheet arithmetic.
For example, a composition question should not enter the calculation sheet with chained-dollar component levels merely because those columns were adjacent in the download. The source-selection step should catch the mismatch before any chart is built.
Review the sheet with a sentence rather than only a formula: “This percentage is the component's current-dollar value divided by the compatible current-dollar total.” If the sentence cannot be written accurately, the calculation may not have a clear interpretation.
Preserve official contributions instead of reverse-engineering them casually
If the publisher supplies contribution-to-growth values, retain their identifiers and notes. Do not assume an apparently similar calculation from displayed levels will reproduce them. The underlying method can use information and weighting not preserved in a rounded table.
If an independent reproduction is required, use the full documented method and sufficient source precision. State the scope and any residual difference. A close numerical resemblance is not proof that the formula is methodologically identical.
This distinction matters for revisions as well. A change in one component's displayed level may not map one-for-one to the change in its contribution. Read the updated contribution series rather than inferring it from a convenient subtraction.
Do not mix classifications across releases
An economic component can be renamed, regrouped or otherwise redefined over time. Even a valid operation within one release can become invalid when classifications are mixed. Check whether the component universe is consistent before comparing shares or growth.
If a publisher provides a bridge or comparability note, use it. If not, identify the break rather than pretending the label remained identical. The problem is not solved by rebasing both series to 100; a scale transformation does not make different definitions equivalent.
For a historical article, preserve the classification used at the relevant date. For a current revised history, use a compatible modern series across the chosen window where available. State which choice serves the research question.
A contribution chart is not a causal model
A contribution-to-growth account describes how components enter a measured aggregate under a method. It does not by itself identify the cause of a policy effect or the counterfactual path without an event. Accounting decomposition and causal attribution are different tasks.
Use causal language only when the evidence supports it. A component can account for part of measured growth without establishing why that component changed. Additional institutional facts or a suitable study design may be needed.
This boundary keeps an accurate statistical chart from becoming an overconfident explanation. The contribution account remains useful as a descriptive starting point.
Make the uncertainty of the interpretation visible
Where a source provides estimates rather than complete observations, explain that status. A contribution figure is not a direct meter reading of an entire economy. It is a product of the national-accounts system and its inputs.
That does not make the measure arbitrary or uninformative. It means the analysis should preserve source notes, revisions and methodological limits. Readers can evaluate an argument more effectively when those boundaries are visible alongside the result.
Sources and methodology
The nonadditivity warning was checked against BEA's NIPA Handbook, Chapter 4, Estimating Methods, especially its chained-dollar discussion, on October 19, 2026. The handbook page lists Chapter 4 as December 2023 and identifies limits on later update coverage. All product prices, quantities and fixed-base calculations are original hypothetical examples. No official chain index was calculated and no current GDP, forecast or investment claim is made.
To distinguish chain-type measures from value-added accounting, see Nominal vs Real GDP: How to Separate Prices from Growth and Gross Output vs Value Added: Follow a Product Through the Supply Chain.