
Gross output measures production at a stage of the economy, while value added removes intermediate inputs used at that stage. Adding value added across industries avoids repeatedly counting the same production as it passes through a supply chain.
Both measures are useful. A supplier needs to understand the volume of business moving through production networks. An analyst measuring the economy’s overall output needs a way to account for the contribution made at each stage without treating every transfer as a new final product.
1. Define value added and gross output
BEA describes gross output as principally sales or revenue from production for most industries, with different treatment for margin industries such as wholesale and retail trade. It defines value added as gross output minus intermediate inputs. [1] Intermediate inputs include goods and services used up in producing other output, rather than for final consumption. [2]
That distinction is more precise than calling value added “profit.” Value added also supports compensation and other components of production income. A business can generate substantial value added while having a much smaller accounting profit.
The illustration below uses simplified manufacturing stages. It is not a complete national-accounting example and does not attempt to model retail margins, taxes, imports, inventories or capital consumption.
2. Trace value added through three fictional stages
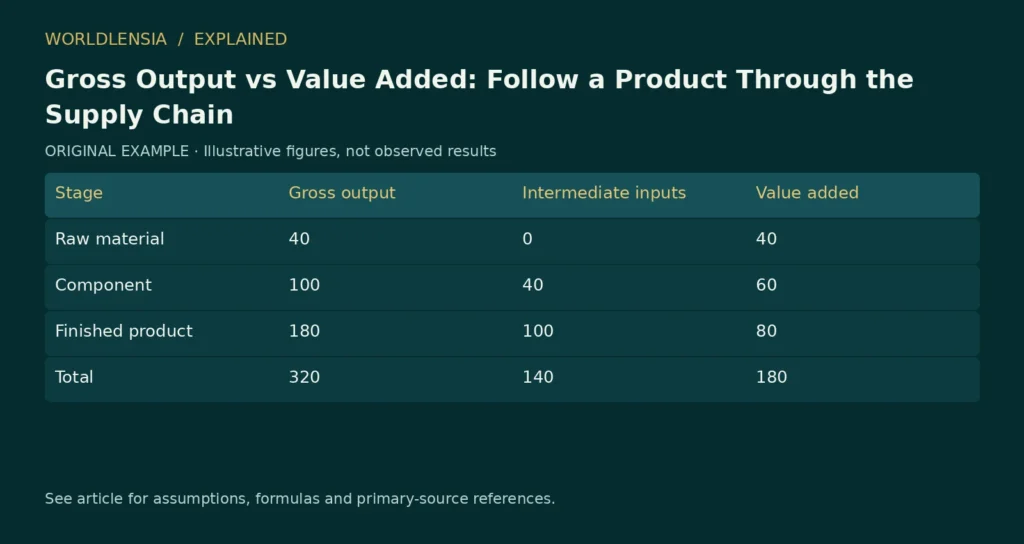
Suppose a raw-material producer sells material for 40 currency units to a component maker. The component maker sells a component for 100 to a final manufacturer. The final manufacturer sells the finished product for 180 to its final purchaser.
Assume the raw-material stage has no intermediate purchases in this deliberately simplified chain. Assume the only intermediate purchase at each later stage is the product from the preceding stage.
| Stage | Gross output | Intermediate inputs | Value added |
|---|---|---|---|
| Raw material | 40 | 0 | 40 |
| Component | 100 | 40 | 60 |
| Finished product | 180 | 100 | 80 |
| Total | 320 | 140 | 180 |
The three gross-output values sum to 320. The three value-added contributions sum to 180, equal to the final product’s value under these assumptions. The earlier material and component have not disappeared. Their values are embodied in the finished product.
Calling the 320 total “GDP from this product” would repeatedly count the upstream production. Calling gross output useless because it exceeds 180 would make the opposite mistake. It describes economic activity across production stages, answering a different question.
3. Check how supply-chain structure changes the comparison
Consider a fictional firm that brings component production in-house. Transactions that previously occurred between separate firms may no longer appear as the same external sales. A measure based on transactions between stages can change even when the final product and overall production contribution do not change in the same way.
This is one reason to identify what a chart measures before interpreting a change as stronger final demand. More intermediate purchases can reflect outsourcing, a longer supply chain or more costly inputs. The direction alone does not reveal which explanation is correct.
An input-cost increase can also raise a firm’s sales value without producing an equal increase in its value added. If sales rise from 180 to 200 while intermediate inputs rise from 100 to 125, value added falls from 80 to 75. These figures are illustrative and hold other complications aside.
Keep prices and quantities separate
The examples use current values. A change in currency-valued output can reflect both prices and quantities. If the question concerns growth in production volume, use an appropriate real measure and read its methodology.
Our nominal versus real GDP guide explains this separate distinction. Gross output versus value added tells you what is included; nominal versus real tells you how price changes are handled. Those two decisions should not be collapsed into one label.
Likewise, check whether the data concern an individual industry or the entire economy. An industry’s purchases from another industry are intermediate inputs for the buyer and output for the seller. A national total requires a consistent accounting boundary.
Read industry claims with a short reconciliation
When a report says that an industry contributes a certain amount to the economy, identify whether the amount is revenue, gross output, direct value added or a model-based estimate including indirect effects. Those are not interchangeable measures of contribution.
Ask for the period, geography, price basis and treatment of imported inputs. If indirect effects are included, find the model assumptions and avoid adding overlapping estimates from several reports. A supply-chain impact model can be useful without being a direct observation of GDP.
For a company comparison, also read the company’s accounting definitions. Its revenue line is not automatically the same as the gross-output concept used in an industry account, especially where margin-based measurement applies.
The most useful explanation follows the transaction and then identifies the new contribution at each stage. That makes clear why a large production network can have gross transactions far above the value of its final output without creating a contradiction in the accounts.
Trace a second example with an imported input
Suppose a fictional domestic manufacturer sells a finished product for 200 currency units. It uses imported material valued at 70 and domestically purchased production services valued at 30. Under this simplified example, its value added is 200 − 70 − 30 = 100.
The imported material is part of the product’s gross value but is not a domestic production contribution made by this manufacturer. The domestic service supplier may have its own value added, after subtracting its own intermediate inputs.
To calculate an economy-wide contribution, follow the domestic production boundary consistently. Do not add the manufacturer’s full sales to the service supplier’s full sales and describe the total as new domestic value. Equally, do not subtract the same intermediate contribution twice after already using value-added measures.
This illustration omits many national-accounting details. Its purpose is to make the boundary visible, not to reconstruct an official table from a company invoice.
Vertical integration changes recorded transactions
Imagine a component business with output of 100 and value added of 60 is acquired by the final manufacturer. If the component is now transferred internally rather than sold between separate firms, an external transaction may disappear from a company-revenue comparison.
That organizational change does not establish that fewer components were produced or that the final product became less useful. The accounting boundary changed. An analysis of a company’s reported revenue must therefore distinguish business restructuring from changes in the quantity of final output.
For industry data, classification and establishment boundaries have their own methods. A company example cannot be mapped mechanically into an official industry series. Read the relevant statistical framework before attributing an observed change to integration.
Inventory introduces another timing distinction
Production and final sale need not occur in the same period. A manufacturer can produce goods and hold them in inventory. A later customer sale can draw down those goods rather than represent newly produced output in that later period.
A simple sales-only story can therefore miss timing adjustments. The official accounts have methods for treating inventory and other components; a small classroom supply chain deliberately excludes them to isolate one relationship.
When using a business report to discuss national output, identify whether the number is sales, production or a change in inventory. Do not assume that a revenue increase in one quarter equals the same quarter’s contribution to GDP.
Do not equate the residual with disposable profit
In the initial fictional chain, the final manufacturer’s value added is 80. That is the amount remaining after the specified intermediate purchases, not automatically cash available for the owner to withdraw.
Workers’ compensation and other relevant production-income components must still be considered under the accounting framework. The example’s residual is useful because it identifies the new contribution at that stage, but it is not a personal-income or cash-flow calculation.
A company can also recognize costs and revenue at times that differ from cash payments. If the practical question concerns liquidity, use a cash-flow analysis rather than relabeling value added as cash generated.
Use a claim-level reconciliation when reading impact reports
Suppose a promotional report says an industry generates 500 million in sales and supports 300 million in wider economic effects. Before adding the figures, ask whether the wider effect includes the direct activity already counted in sales and whether the units are compatible.
One figure might be gross output while another is value added. One might be observed while the other comes from a model. Combining them can create a number with no consistent meaning even when both original calculations are valid within their own scope.
A source ledger should record the exact measure, model boundary, direct and indirect components, period and price basis. If those details are absent, report the uncertainty rather than turning the largest available number into an economic-contribution headline.
The principle throughout is to follow the same production once through a clearly defined account. Gross output illuminates the network of activity; value added identifies the contribution that can be combined without repeatedly counting intermediate production.
An accounting diagram should also identify every simplification. The fictional chain excludes imported production, inventory movements and margin-industry treatment. Those exclusions make one relationship easy to see; they are not a claim that the full economy consists only of the three displayed transactions.
Sources and method
- BEA gross output and value added FAQ. Publication date not established. Checked October 20, 2026.
- BEA intermediate inputs FAQ. March 10, 2006; modified April 24, 2018. Checked October 20, 2026.
Numerical teaching examples are original and illustrative unless explicitly identified otherwise. No hands-on product testing or individual medical assessment is claimed.
To distinguish production stages from aggregate output measures, see GDP and GDI: Two Measurements of the Same Economy Can Differ.