
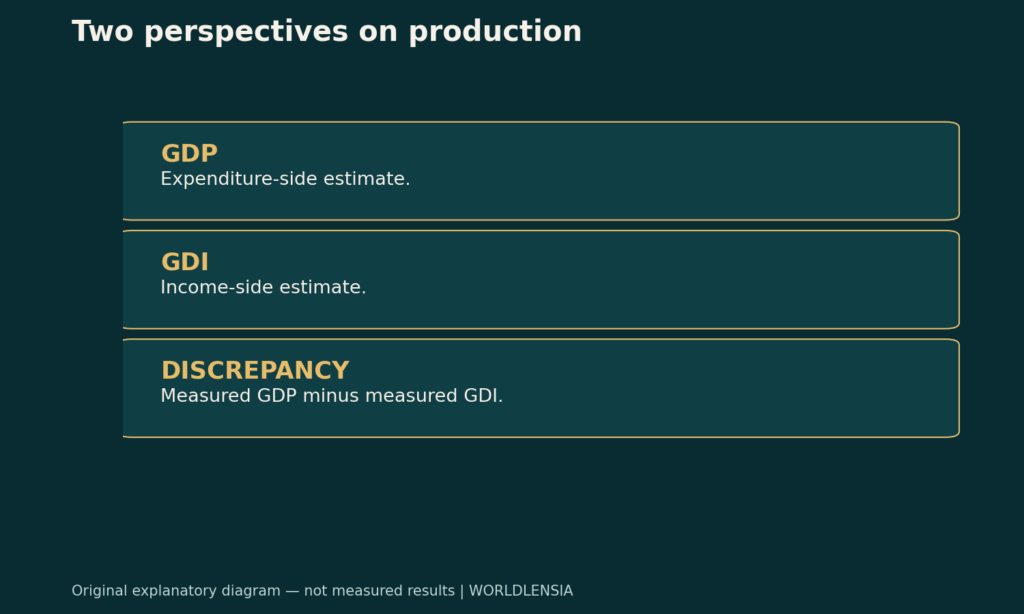
GDP and GDI measure production from different sides. In theory, expenditure on production corresponds to the income and costs generated by that production. Published estimates can still differ because they draw on different source information.
That measured gap is called the statistical discrepancy. It is not, by itself, proof that output disappeared, that one measure is fraudulent or that an analyst can identify the missing activity simply by subtracting two numbers. The difference is a signal to understand the measurements and their sources.
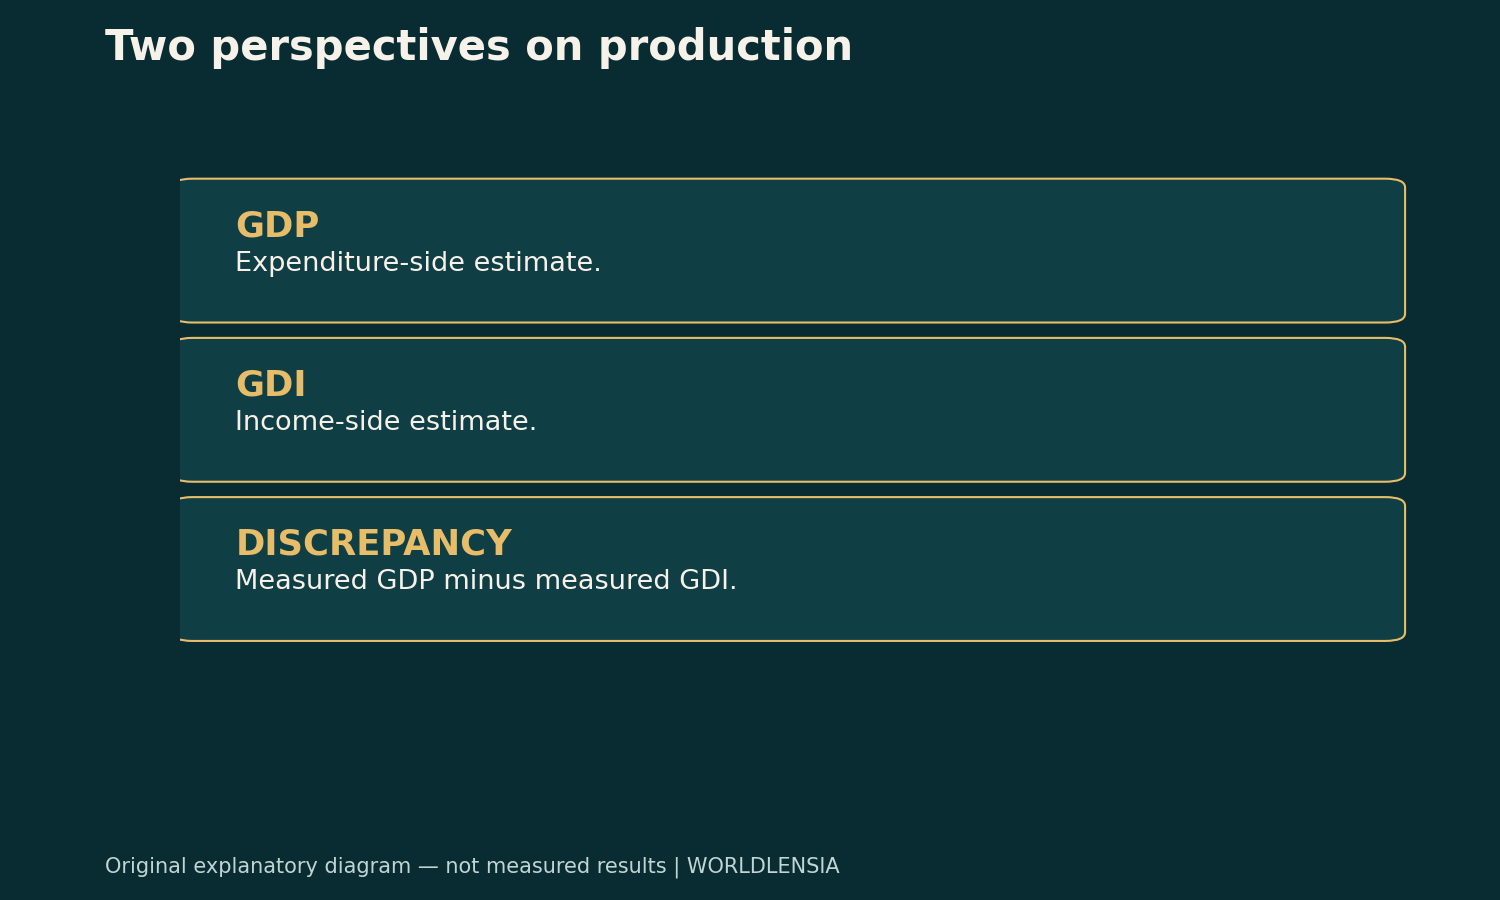
GDP and GDI: Two perspectives, one accounting relationship
GDP is commonly introduced through expenditure categories. GDI approaches the activity through income and costs associated with production. The Bureau of Economic Analysis explains that the estimates use different source information, which helps explain why measured values do not match perfectly.
Keep the conceptual relationship separate from the empirical estimates. An accounting identity describes how quantities relate in a consistent framework. Producing estimates requires real surveys, administrative information, timing conventions and estimation methods. Those inputs do not arrive with perfect completeness and identical accuracy.
The important lesson is not that either perspective can be ignored. It is that a discrepancy should be named and investigated within the source methodology rather than explained with a story that the arithmetic alone cannot establish.
An original numerical account
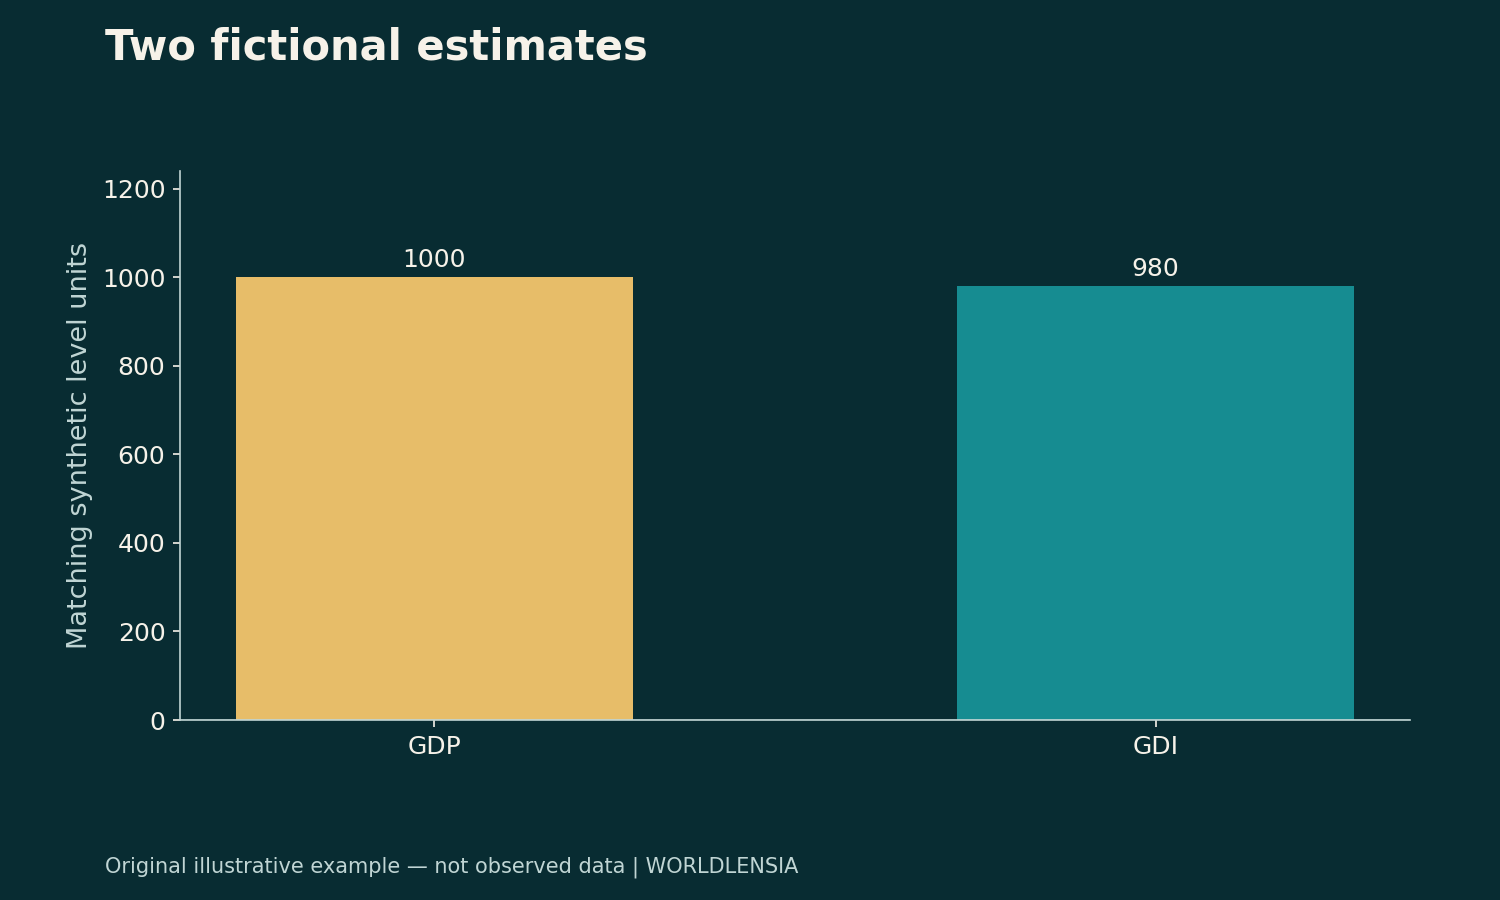
Suppose a fictional economy has estimated GDP of 1,000 units and estimated GDI of 980 units for the same period and on a compatible basis. GDP minus GDI is 20 units. That is the measured discrepancy under this simplified account.
| Synthetic measure | Value in matching units |
|---|---|
| GDP estimate | 1,000 |
| GDI estimate | 980 |
| GDP minus GDI | 20 |
Relative to the fictional GDP estimate, the difference is 20÷1,000=2%. That calculation uses GDP as its denominator. If an analyst chooses another denominator, it must be stated. An unlabeled percentage can make a simple discrepancy harder to interpret.
These values are invented. They are not a current reading for the United States or any other economy. The calculation identifies the size and sign of the difference; it does not identify the source of the difference.
Avoid turning a gap into a causal explanation
An analyst might be tempted to say the 20-unit gap represents unrecorded wages, hidden profits or overstated spending. Any of those claims would require evidence about particular source components and methods. The discrepancy alone does not select one explanation.
Different timing, coverage or revisions can affect the available estimates. To evaluate a specific case, read the release notes and the relevant technical material. Compare like periods and identify which components changed. Do not treat a plausible general mechanism as a verified account of the observed gap.
The same discipline applies to headlines. “The two estimates differ” is a measurement statement. “The difference proves the economy is weaker than reported” is a broader inference that needs a defensible method and additional evidence.
Match the period, units and vintage
A comparison can be invalid before the economic interpretation begins. Check whether both numbers refer to the same quarter or year. Distinguish current-dollar levels from inflation-adjusted measures, and keep annualized rates separate from unannualized changes.
Also check the release vintage. A revised GDP estimate should not be compared casually with an older GDI value without explaining the mismatch. The source period may be the same while the information incorporated into each estimate differs.
Save the release date and observation period in separate fields. If a table comes from a later update, preserve the later version rather than describing it as the number that readers would have seen at the earlier date. That makes changes in the comparison understandable.
Level differences and growth differences are separate
Two series can differ in level while displaying similar changes over a particular interval. They can also display different growth rates when their source estimates change at different speeds. Do not assume that a level discrepancy translates directly into the same percentage-point difference in growth.
For a transparent fictional extension, let GDP rise from 1,000 to 1,020 and GDI rise from 980 to 1,009.4. GDP grows 2%; GDI grows 3%. The initial 20-unit gap narrows to 10.6 units. That relationship follows the invented values, not a rule that GDI always grows faster when it starts lower.
Keep the calculation visible if you use an example. Readers should be able to distinguish the growth rates from the levels and the discrepancy from either one. A chart that mixes them without clear scales makes the comparison less useful.
Read multiple measures without inventing a verdict
Looking at both perspectives can encourage a more careful account of the available evidence. It does not give permission to choose whichever series best fits a preferred story. State which question each measure helps answer and what limitations remain.
If you use a combined measure, identify its source and method rather than improvising an average and presenting it as an official total. A new transformation is an analyst's calculation unless the publisher defines it otherwise.
For the price/output distinction, see nominal versus real GDP. For a population-adjusted question, see GDP per capita. Neither transformation removes the need to check the source and vintage of the underlying estimate.
A concise reporting checklist
Before writing, record the measure names, observation period, release dates, units, adjustment basis and exact source tables. Calculate the discrepancy in compatible units. If you express it as a percentage, label the denominator. If the values have been revised, distinguish the updated comparison from the earlier one.
Then separate what is measured from what is inferred. “GDP exceeds GDI by 20 units in this hypothetical table” follows directly from the arithmetic. Explaining why it does so requires a different evidentiary step. Preserving that boundary is the central skill in reading the comparison fairly.
Do not infer household income from the aggregate
GDI is an economy-wide account, not the typical household's income. A change in the aggregate does not establish how the gain is distributed or what happened to a particular family's purchasing power. Those questions need compatible household and price evidence.
Keep the level of analysis in the headline. A national production-account comparison should not become a personal-income claim simply because the measure contains the word income.
Sources and methodology
The GDP/GDI relationship and statistical-discrepancy concept were checked against BEA's explanation of why GDP and GDI differ on October 19, 2026. A publication/update date was not established in the captured text. All levels, growth rates and scenarios here are original synthetic examples. Historical correlations in the source are not reproduced as current findings, and no investment advice or economic forecast is offered.
To connect the statistical discrepancy with production accounting, see Nominal vs Real GDP: How to Separate Prices from Growth and Gross Output vs Value Added: Follow a Product Through the Supply Chain.