

A city with a shorter average commute does not necessarily offer a shorter journey for every worker. The average can hide a large group with long trips, differences between transport modes, and the effect of who is included in the measure.
Census commuting statistics cover questions about travel to work, including travel time and transportation. They are useful for understanding workers' journeys, but a commute measure is not a complete measure of daily travel, transport access, or neighborhood convenience.
The same mean can hide different experiences
Consider two fictional groups of five commuters. Group A travels 20, 20, 20, 20, and 20 minutes. Group B travels 5, 5, 10, 20, and 60 minutes. Both means are 20 minutes. Group B's median is 10, and one worker faces an hour-long journey.
| Group | Mean | Median | Share traveling at least 60 minutes |
|---|---|---|---|
| A | 20 min | 20 min | 0% |
| B | 20 min | 10 min | 20% |

Figure data and assumptions
Original hypothetical teaching data; see the caption and article for assumptions.
| Category | Group A | Group B |
|---|---|---|
| Worker 1 | 20.0 | 5.0 |
| Worker 2 | 20.0 | 5.0 |
| Worker 3 | 20.0 | 10.0 |
| Worker 4 | 20.0 | 20.0 |
| Worker 5 | 20.0 | 60.0 |
The original distribution chart makes the long trip visible. These are teaching groups, not survey samples or a statement about a real city.
Check who belongs in the denominator
Read the table's universe. Workers who commute, workers working from home, and all residents are different populations. If a published travel-time measure excludes home workers, do not add them as zero-minute commuters and continue using the original label.
A shift toward remote work can change the composition of remaining commuters. The measured average may rise if short-trip workers disproportionately stop commuting, even without longer trips for the people still traveling. Investigate composition before explaining a change solely as worsening traffic.
Time, distance and reliability differ
A short-distance trip can take a long time because of congestion, transfers, or waiting. A longer-distance trip may be fast. Neither mean distance nor mean time automatically describes reliability from one day to the next.
Someone whose journey varies between 20 and 60 minutes faces a different planning problem from someone who consistently travels 40. A survey measure of usual travel time may not capture that daily variation. Use appropriate transport data if reliability is the question.
Compare transport modes thoughtfully
Mode-specific averages can reflect where people live and work, not just the inherent speed of the mode. A rail trip from a distant suburb and a walk within a city center serve different journeys. An unadjusted comparison does not establish how long either worker's alternative trip would take.
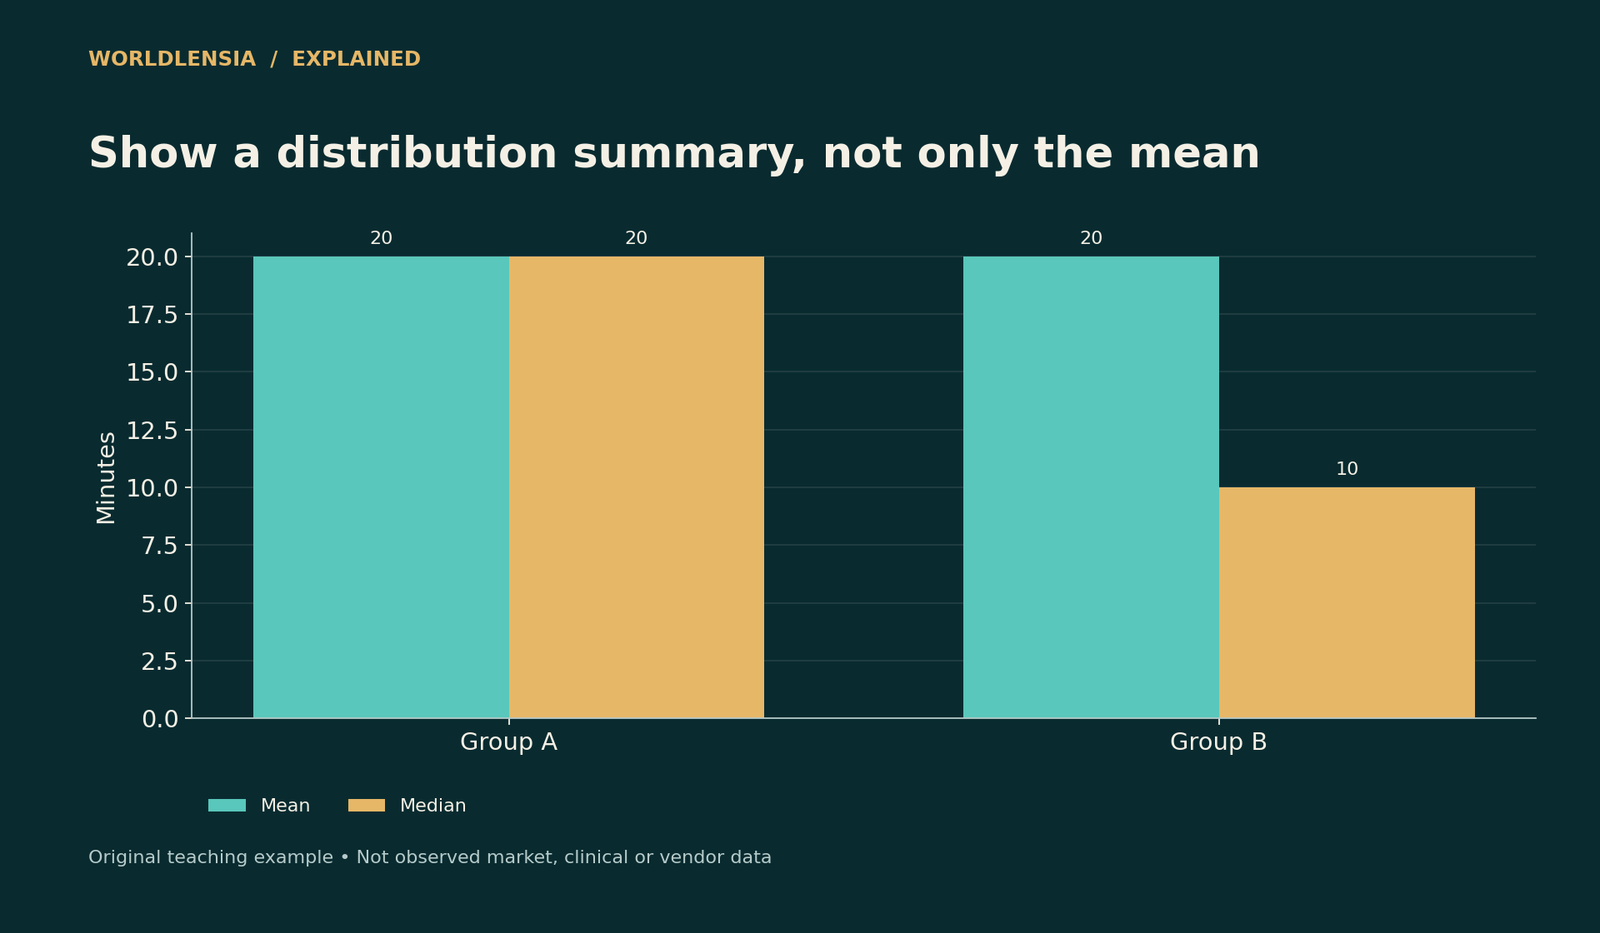
Figure data and assumptions
Original hypothetical teaching data; see the caption and article for assumptions.
| Category | Mean | Median |
|---|---|---|
| Group A | 20.0 | 20.0 |
| Group B | 20.0 | 10.0 |
Examine trip lengths, geography, access time, and service coverage. Avoid turning an association into a causal claim that switching every worker to one mode would produce the observed average difference.
Boundaries matter again
A city can draw workers from outside its boundary, and its residents can work elsewhere. A residence-based commute measure and a workplace-based measure describe different groups. Match the geography and population across a ranking.
WorldLensia's city-versus-metropolitan-population guide explains why a central city should not be compared casually with another region's entire metro area. The same boundary discipline applies to commuting.
Show the tail and uncertainty
Alongside the mean, consider a distribution across travel-time bands or the share with long commutes. Small-area estimates may have meaningful margins of error. Do not treat tiny printed differences as a precise ordering of transport systems.
When aggregating groups, weight by the relevant number of commuters rather than averaging city means equally unless equal-city weighting is the intended measure. A small town and a large city should not contribute equally to a commuter-weighted national average by accident.
Keep the conclusion within the evidence
A careful article might say that the average usual one-way commute among a defined group is shorter, while a particular share still reports long journeys. It would identify the survey period and note that non-work trips, transport costs, and reliability are separate questions.
That is more useful for readers than labeling one city “easy to travel in” from a single mean. A commute statistic can guide investigation; it cannot replace the route, schedule, budget, and accessibility needs of an individual traveler.
One final unit check
Confirm whether the reported duration is one-way travel or a round trip. Doubling a one-way mean can illustrate a return journey only under an explicit symmetry assumption. Actual return routes, waiting, and traffic can differ, and neither measure automatically includes non-work stops.
A statement that 20% of workers have a long commute should identify which workers and the duration threshold. A share among commuters differs from a share among all residents. Keep the denominator in the sentence or caption. If combining areas, add compatible counts before calculating the share. Do not average percentages from differently sized worker populations by accident. This small reporting step is especially useful in short social summaries, where a detached percentage can easily lose the population and time period that made it meaningful in the original table.
Sources and methodology
Census commuting guidance and its commuting-data overview were checked October 18, 2026. The two five-worker groups and all calculated summaries are original hypothetical examples.
- Census: Commuting guidance — checked October 18, 2026.
- Census: Commuting overview — checked October 18, 2026.
Continue with Match city boundaries and Read margins of error for related context.
To connect commute summaries with transit counts and boundaries, see Transit Ridership: Boardings Are Not the Same as Unique Passengers and City vs Metro Population: Why the Boundary Changes the Answer.