

Average order value can rise while order revenue falls. The ratio becomes larger when revenue per recorded order increases, but that does not establish that more customers purchased, that total sales increased or that the business earned more profit.
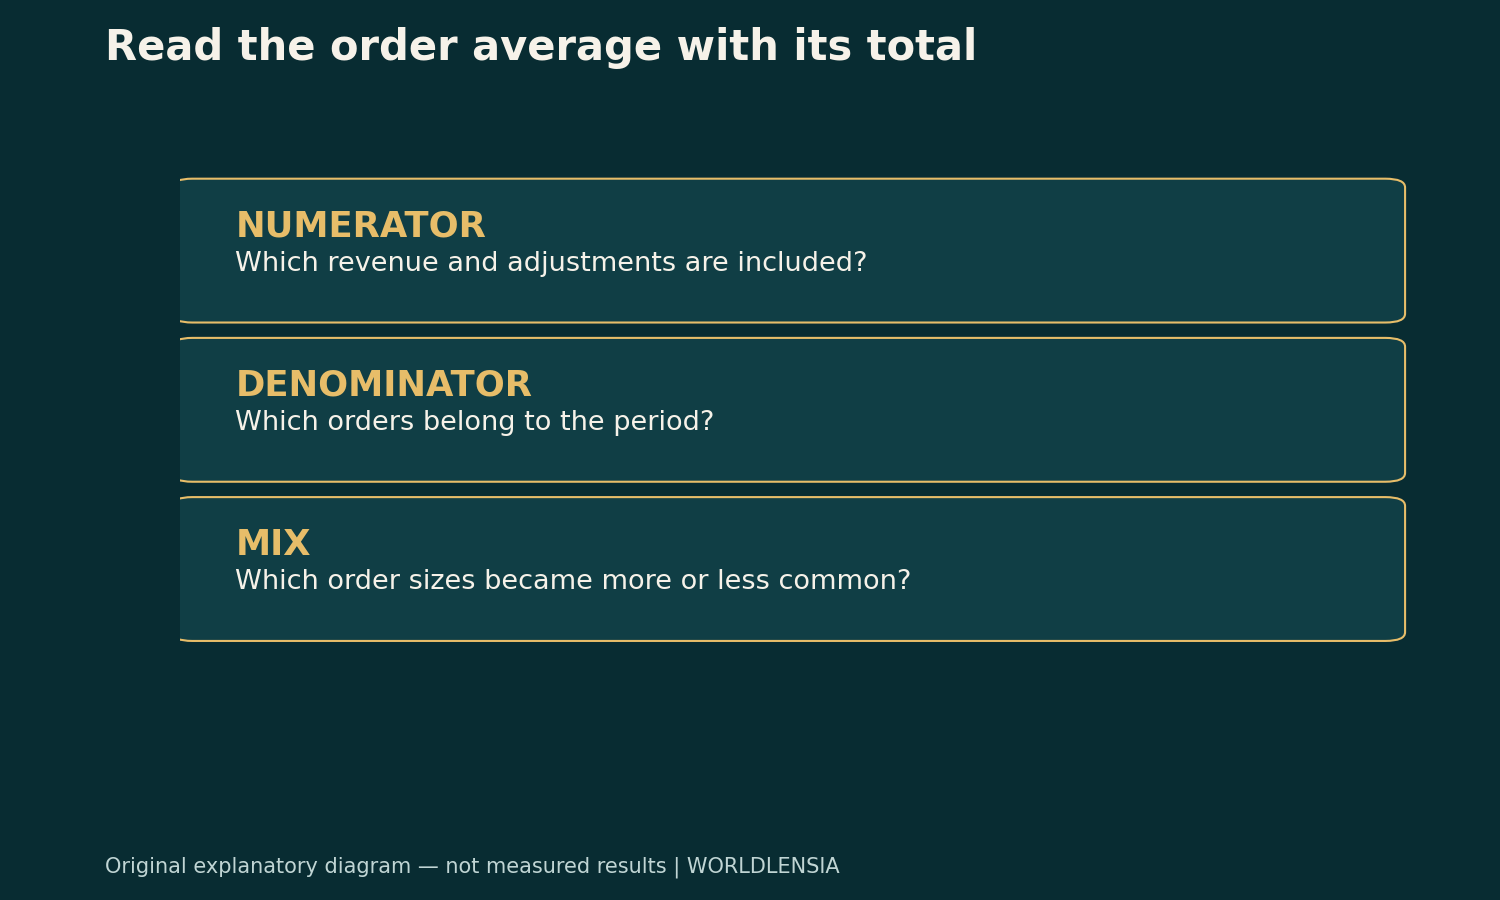
One reason is order mix. If many small orders disappear while larger orders remain, the average can improve even as the business loses activity. Read the numerator, denominator and distribution before celebrating the ratio.
Average order value: Define the metric before using it
Different systems can define order value differently. Check which sales amounts are included, which adjustments are excluded, how orders are counted and what date determines the reporting period. Do not assume that two dashboards use the same convention because both display “AOV.”
Shopify's sales-report documentation, for example, defines its AOV using gross sales less discounts divided by orders, excluding post-order adjustments. That is a documented platform convention, not a universal rule that every business must use for every analysis.
If your analysis uses another definition, write it beside the result. A ratio that includes tax and shipping answers a different question from one limited to product revenue. A measure revised for later returns may differ from the value recorded when the original order was placed.
A fictional store with two order sizes
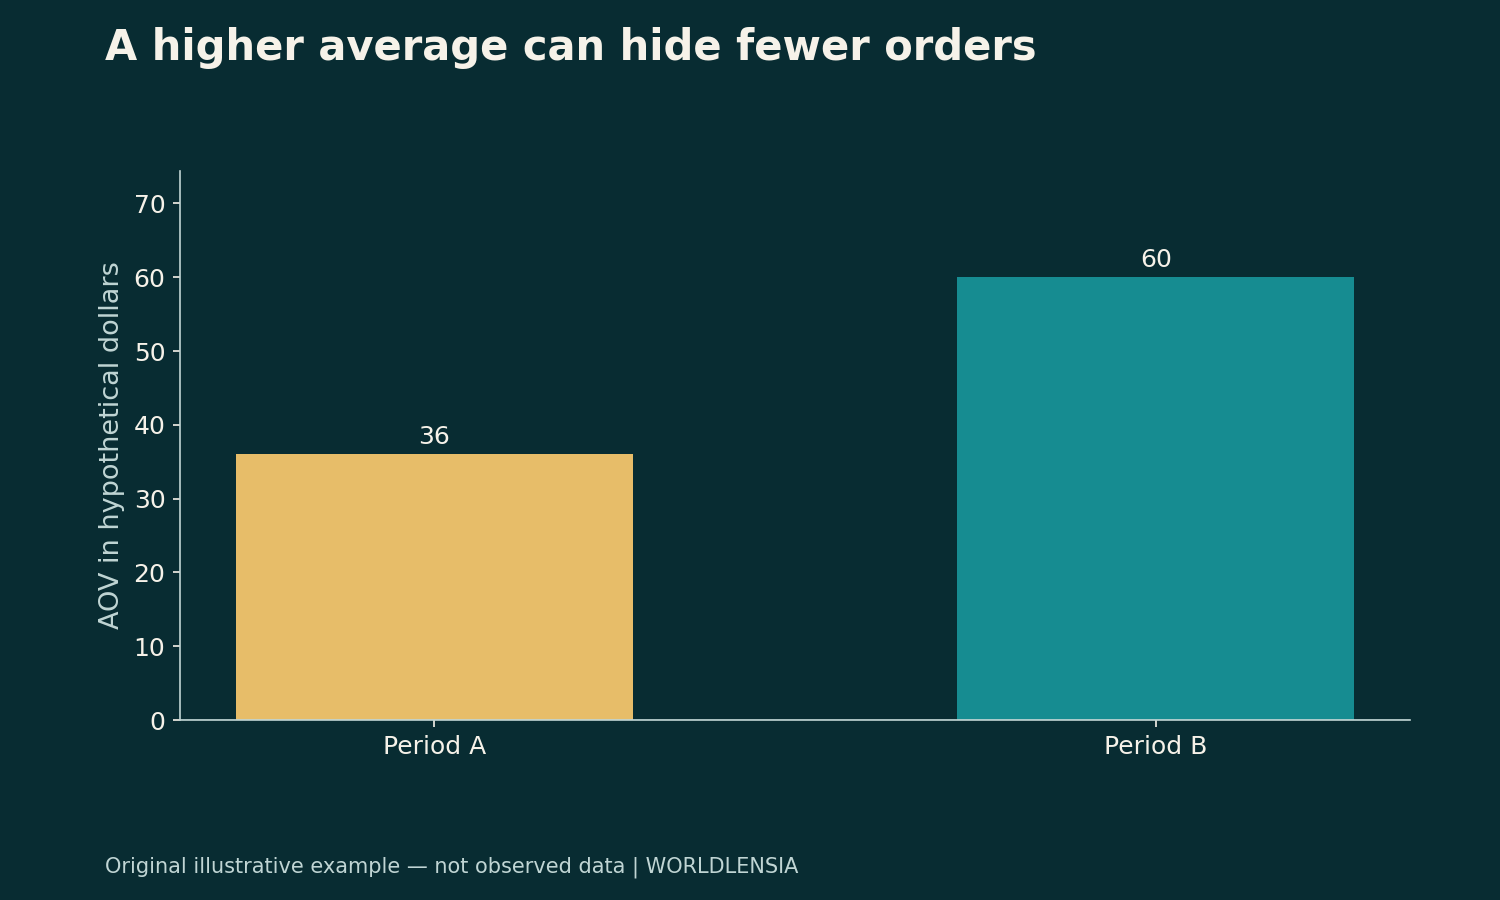
In period A, imagine a store receives eighty orders worth $20 each and twenty orders worth $100 each. The small orders contribute $1,600 and the large orders $2,000. Total order revenue is $3,600 across 100 orders, so AOV is $36.
In period B, the store receives twenty $20 orders and twenty $100 orders. Revenue becomes $400 plus $2,000, or $2,400. There are 40 orders, so AOV is $60.
| Synthetic period | $20 orders | $100 orders | Total revenue | Orders | AOV |
|---|---|---|---|---|---|
| A | 80 | 20 | $3,600 | 100 | $36 |
| B | 20 | 20 | $2,400 | 40 | $60 |
The average rises by two thirds, from $36 to $60. Total revenue falls by one third, from $3,600 to $2,400. Large-order count is unchanged; the apparent improvement is created by the disappearance of many smaller orders.
These are invented transactions with no tax, shipping, discounts or later adjustments. The stripped-down account isolates the mix effect. It does not describe a real store or establish why the smaller orders disappeared.
Decompose the change without inventing a cause
The example supports a narrow statement: the share of orders in the larger category increased while the total number of orders declined. It does not prove that a promotion failed, a website problem discouraged customers or a pricing change caused the decline.
Those explanations need additional evidence. Compare channel activity, product availability, customer groups and changes in reporting definitions. Check whether the periods cover comparable days and whether a one-time bulk transaction affects the average.
Avoid assigning a story to every movement. A useful operating report first reconciles the counts and amounts. It then identifies questions that the available data can test, rather than turning the headline ratio into a verdict.
Keep the total beside the average
For a consistent definition, total included revenue equals order count multiplied by average included order value. That identity is a helpful reconciliation. If the displayed fields do not reproduce one another within rounding, investigate their scope before interpreting the difference.
The identity also shows why the two drivers should be reported together. More revenue per order may be outweighed by fewer orders. Conversely, a lower AOV may accompany more total revenue if order count grows enough. Neither movement is automatically good or bad without the business question.
Include a distribution when it adds meaning. The median order, a few order-size bands or the share of revenue from large transactions can reveal changes hidden by one mean. Label any segmentation clearly and keep the same rules across comparison periods.
Orders are not customers
A customer can place several orders. AOV therefore does not show how much an average customer spends unless the analysis explicitly connects orders to customer identities and a time period. Changes in purchase frequency can affect the customer story without being visible in AOV alone.
The customer-cohort retention guide follows a fixed starting group so new arrivals do not hide what happened to existing customers. That is a different question from transaction mix. Use both when the decision requires both, rather than renaming an order ratio as retention.
Be careful with guest checkouts, merged customer records or orders placed through different channels. The quality of a customer-level conclusion depends on the identity rules used to connect those records.
Higher order value is not higher profit
A larger order can contain products with different margins, heavier shipping requirements or additional service work. AOV does not subtract those costs. It also does not describe when cash arrives or when suppliers must be paid.
The revenue, profit and cash-flow guide separates those signals. A transaction metric can contribute to the analysis, but it should not silently become a profitability or liquidity measure.
When evaluating a tactic intended to increase basket size, decide which outcome matters. If the goal is sustainable contribution, collect the relevant costs and compare a credible baseline. If the goal is customer convenience, measure that experience rather than assuming larger orders prove it improved.
Write the conclusion with its denominator
A clear account of the fictional store is: “AOV increased from $36 to $60, while orders fell from 100 to 40 and included revenue fell from $3,600 to $2,400.” Readers can see the whole relationship without needing to infer the missing total.
Keep the metric definition, period and adjustment treatment nearby. That turns AOV into a useful diagnostic measure instead of a stand-alone success badge.
Use a consistent order population
Check whether canceled, test, draft or otherwise excluded orders enter the denominator. A change in filtering can move AOV without a change in customer baskets. Preserve the report settings and compare the same population across periods.
If a reporting definition changes, do not splice the old and new values into a seamless trend without a note. Recalculate a compatible history where possible or show the break. This protects a useful operating metric from being turned into a misleading growth story by a hidden filter change.
That record also makes later exports easier to reconcile.
Sources and methodology
The platform-specific AOV definition was checked against Shopify's sales-report documentation on October 19, 2026; its publication/update date was not established. The order mix, figures, calculations and analytical recommendations are original fictional teaching material. They are not observed merchant results or a promise that any sales tactic will work.
To check customer retention and margin alongside the order average, see Customer Retention: Follow the Same Cohort Before Celebrating Growth and Gross Margin vs Markup: Price a Product Without Mixing Formulas.