
Revenue per employee measures sales value relative to a headcount measure. Labor productivity measures output relative to labor input, commonly hours worked in official statistics. A rise in the first does not automatically establish a rise in the second.
Prices, product mix, working hours and outsourcing can all change revenue per employee. To interpret a productivity claim, identify the output measure and the labor denominator before explaining why the ratio moved.
Start with the units
BLS describes labor productivity as output per hour and publishes related measures for defined sectors. [1] Its productivity program provides the associated data and methodology. [2] A company’s revenue divided by employees is a different ratio, even if a presentation calls both “productivity.”
Revenue is expressed in money. Output may require a real or quantity-based measure to separate production from price changes. Employee headcount is a count of people, while hours measure time. Neither distinction disappears because the ratio is easy to calculate.
This article uses fictional manufacturing examples. It does not estimate the performance of a real company or claim that one simple unit count is suitable for every service business.
A price rise can lift revenue per employee
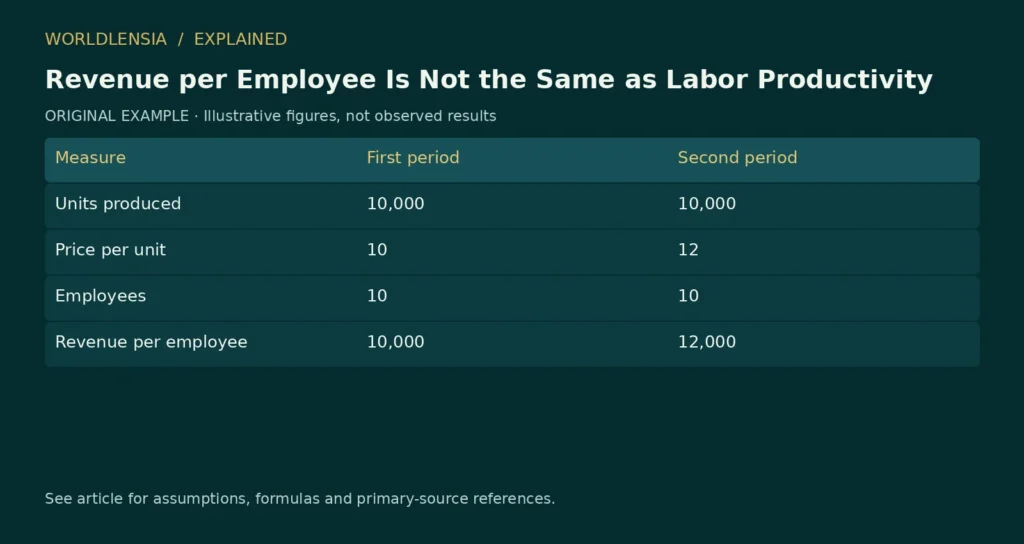
Suppose a business produces 10,000 identical units at a price of 10 currency units each. Revenue is 100,000. With ten employees, revenue per employee is 10,000.
In the next period, the same ten employees produce the same 10,000 units, but the price rises to 12. Revenue becomes 120,000, and revenue per employee becomes 12,000, a 20% increase.
| Measure | First period | Second period |
|---|---|---|
| Units produced | 10,000 | 10,000 |
| Price per unit | 10 | 12 |
| Employees | 10 | 10 |
| Revenue per employee | 10,000 | 12,000 |
The ratio rose without a change in unit output or headcount. If hours were also unchanged, unit output per hour would be unchanged. The increase is a price effect under these assumptions.
That does not mean the business received no benefit. It means the ratio alone cannot establish improved technical production efficiency.
More hours can produce more output without higher hourly productivity
Imagine the same business initially uses 2,000 labor hours to produce 10,000 units. Output per hour is five units. Later it uses 2,400 hours to produce 12,000 units, again five per hour.
Output per employee could rise if headcount stays the same, but output per hour remains unchanged. Overtime, part-time work and changes in staffing patterns can therefore affect the relationship between headcount-based and hour-based measures.
Use average or period-consistent headcount when appropriate. Dividing a full year’s revenue by the headcount on a single unusual date can distort the comparison. State whether contractors and temporary workers are included.
Outsourcing changes the boundary
A firm can reduce employees by buying a service previously performed internally. Revenue per remaining employee may rise even if the total labor needed across the supply chain does not fall.
The purchased service also affects costs and value added. A useful assessment should consider the business boundary and the task being evaluated. A company-level ratio cannot automatically describe economy-wide productivity.
Similarly, an acquisition can add revenue and employees at different dates or change the mix of activities. A year-over-year ratio may need a comparable-business explanation before it can support a story about better operations.
Product quality and mix complicate output measurement
Counting units works in the simplified example because every unit is assumed identical. In a real business, products differ in quality and production requirements. One complex service engagement is not necessarily equivalent to one simple transaction.
A revenue measure captures prices and mix but does not isolate real output automatically. An operational count can be transparent but omit quality differences. Explain the chosen measure and what it leaves out rather than claiming that one ratio resolves every comparison.
If quality declines while unit output rises, the apparent improvement may not represent more useful output. Include relevant quality evidence such as defect rates or successful task completion where those measures are well defined.
Avoid attributing the entire change to workers
Output per hour can change with equipment, software, management, purchased inputs and the production environment. A rise does not mean individual workers alone caused it, and a decline does not by itself demonstrate lower effort.
Our guide to capacity utilization and bottlenecks shows why a busy part of a process can coexist with constraints elsewhere. Productivity interpretation also benefits from examining the whole production system rather than assigning a cause from one ratio.
For a transparent comparison, record the output concept, price treatment, hours or headcount definition, business boundary, period and quality measures. Then decompose the main observable drivers.
A stronger headline says what was measured: “Revenue per employee rose after prices increased,” or “Unit output per labor hour rose under comparable quality.” Those statements give readers a result they can assess without turning a convenient sales ratio into an unsupported claim about efficiency.
Decompose a fictional revenue ratio
Assume a business sells one identical product. Revenue per employee can be expressed as price per unit multiplied by units per hour multiplied by hours per employee. This identity is a teaching device for a simple single-product business, not a complete formula for an official productivity series.
Initially, price is 10, output is five units per hour and hours per employee are 200. The product is 10 × 5 × 200 = 10,000 revenue per employee. If price rises to 12 and the other two terms stay fixed, the ratio becomes 12,000.
If instead output per hour rises to six while price stays 10 and hours stay 200, the same 12,000 ratio results. The headline increase is identical, but its mechanism differs. A third scenario could increase hours while holding hourly output fixed.
This decomposition helps an analyst ask for the missing evidence. It does not establish which mechanism actually occurred without observing prices, quantities and hours.
Add a quality constraint to an operations example
Suppose a fictional process initially makes 1,000 units in 200 hours, but 100 units fail the stated quality check. Gross output per hour is five, while accepted units per hour are 900/200 = 4.5.
A later process makes 1,100 units in the same 200 hours, with 220 failing the check. Gross output per hour rises to 5.5, but accepted units per hour fall to 880/200 = 4.4. Whether “productivity improved” depends partly on what output the decision requires.
All figures are synthetic. A real quality measure needs its own definition and consistency checks. The example shows why counting every unit produced can be inadequate when the reader cares about usable output.
Distinguish a process metric from a worker assessment
The hypothetical accepted-output rate reflects equipment, material quality, process design and other conditions as well as labor. It would be an unsupported leap to attribute the change entirely to individual effort.
For an operational investigation, inspect where defects arise and whether the quality test changed. If a new test detects problems the old test missed, a lower accepted-output measure could partly reflect improved detection rather than worse production.
A fair comparison preserves the test standard or explains the change. Otherwise the denominator and numerator may be stable while the meaning of an accepted unit has shifted.
Watch changes in business mix
Imagine a company shifting from a low-price standardized product to a more expensive customized service. Revenue per employee could rise even if the number of completed tasks falls. Whether real output increased requires a method that handles the changed products and quality.
A simple unit count would also be misleading if one task now involves much more work. This is why a measurement plan should start with the economic or operational question rather than whichever ratio is easiest to produce from a spreadsheet.
For recurring reports, keep product groups separate where useful and disclose how any combined measure weights them. A change in weights can move the aggregate even if each group’s underlying performance is unchanged.
Build a claim that the evidence can support
Suppose the only verified data are annual revenue and year-end employees. You can calculate a ratio with those definitions, explain the timing mismatch and compare it cautiously with the same measure in an earlier period. You cannot establish a precise change in output per hour without output and hour evidence.
If additional operational data become available, show the bridge rather than silently upgrading the old claim. A source note should identify which values are reported and which are calculated.
A useful report can present revenue per employee as one business indicator alongside output, hours, quality and margin. It remains informative without becoming a claim that sales value alone measures the efficiency or contribution of the workforce.
When reporting a change, keep the numerator and denominator beside the ratio. A rise caused by falling employment is operationally different from one caused by greater output, even if the final percentage matches. Showing both inputs gives readers a way to assess the mechanism without relying on an unsupported narrative about automation or employee effort.
Sources and method
- BLS productivity overview. Living overview; publication date not established. Checked October 20, 2026.
- BLS labor productivity program. Living program page; publication date not established. Checked October 20, 2026.
Numerical teaching examples are original and illustrative unless explicitly identified otherwise. No hands-on product testing or individual medical assessment is claimed.
To separate the revenue ratio from cash flow and operational capacity, see Revenue, Profit and Cash Flow: Three Different Business Signals.