
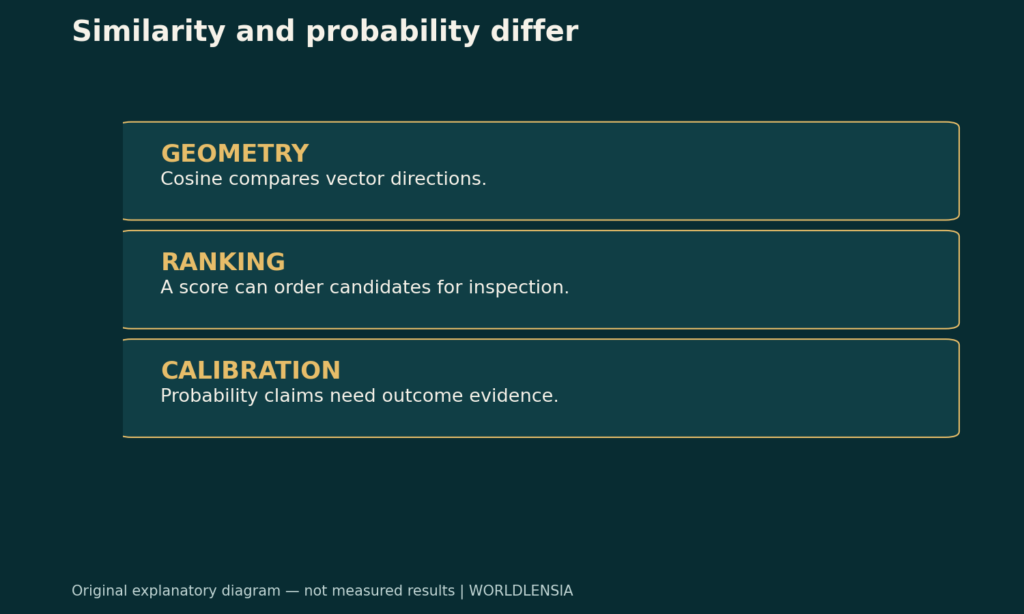
Cosine similarity measures how closely two vectors point in the same direction. A score of 0.8 does not automatically mean an 80% chance of answering your question. The score describes a geometric relationship between vectors. A probability claim needs a separate connection between scores and observed outcomes.
This distinction matters when an AI system retrieves documents before writing an answer. A passage can be close to the question in an embedding space while omitting the needed evidence, discussing a different date, or contradicting the proposed conclusion. Similarity can help select material to inspect; it cannot replace inspecting that material.

Cosine similarity: Start with the formula
For two nonzero vectors, cosine similarity is their dot product divided by the product of their lengths. Dividing by the lengths removes the effect of scale. Vectors pointing in the same direction have cosine similarity 1; perpendicular vectors have similarity 0. Negative values are possible when vectors point in opposing directions.
Google's embedding-similarity documentation distinguishes this angle-based measure from a dot product, which also incorporates vector magnitude. That is the mathematical definition behind the calculation below. It does not establish that a particular retrieval model's scores correspond to the probability that a passage is useful.
An original two-dimensional example
Use a fictional query vector Q=(1,0). Candidate A is (0.8,0.6), whose length is 1. Its dot product with Q is 0.8, so its cosine similarity is 0.8.
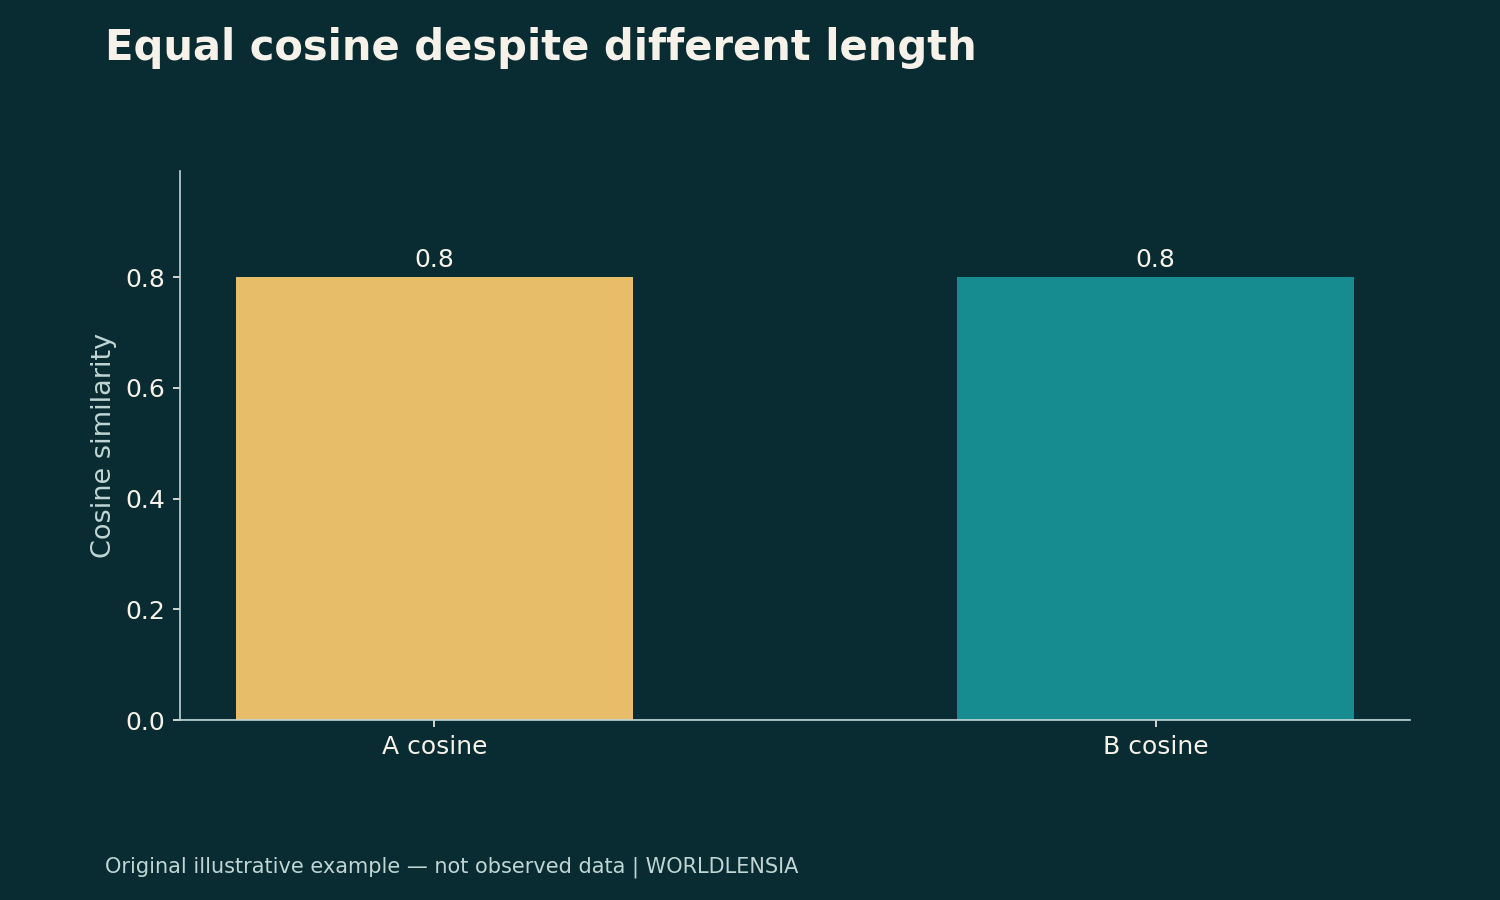
Candidate B is (8,6), whose length is 10. Its dot product with Q is 8. Divide 8 by the product of the lengths, 1×10, and its cosine similarity is also 0.8. B is ten times as long as A, but it points in exactly the same direction.
| Synthetic candidate | Vector | Dot product with Q | Cosine similarity |
|---|---|---|---|
| A | (0.8, 0.6) | 0.8 | 0.8 |
| B | (8, 6) | 8.0 | 0.8 |
These are invented vectors, not embeddings extracted from real documents. Their purpose is to expose the operation of the formula. Nothing in that operation counts how often either candidate supplies a correct answer. Multiplying the result by 100 changes its display, not its meaning.
Ranking and calibration answer different questions
A ranking asks which candidate should be examined before another under a chosen scoring method. Calibration asks whether a stated probability agrees with observed frequencies for a specified event. A system could rank relevant passages well while producing scores that have no direct probability interpretation.
To investigate calibration, first define the event: a reviewer might judge whether a passage contains all the evidence needed to answer a bounded question. Assemble representative questions, label the outcomes using a documented procedure, and examine how the outcome frequency varies across score ranges. Keep the data used to develop any mapping separate from the final evaluation data.
Even an empirically calibrated mapping has a scope. A relationship measured on one document collection, language, question type or embedding model need not hold after those conditions change. Record the model version, retrieval configuration, labeling rules and evaluation period alongside the results.
A threshold needs evidence
There is no universal rule that every document above 0.8 is relevant or that every document below 0.5 is useless. A threshold is a decision policy. Its usefulness depends on what happens after a passage is accepted or rejected.
For a research assistant, accepting an irrelevant passage may waste review time. Rejecting the only passage containing a key qualification may make the answer incomplete. Evaluate both failures against actual questions and the evidence readers need, rather than choosing an attractive-looking number.
The existing WorldLensia guide to RAG chunking and complete evidence explains another part of this problem: whether the retrieved unit preserves enough context. A high similarity score cannot restore a footnote or table heading that was removed before indexing.
Report what the score actually supports
A useful report names the similarity measure and states whether vectors were normalized. It identifies the candidate collection, the query set and any evaluation labels. If a probability mapping was fitted, describe its method and the held-out checks rather than silently adding a percent sign to the raw score.
Keep the explanation proportional to the decision. A reader choosing which document to open may only need a ranked list. A system deciding that no evidence exists needs a stronger evaluation of missed relevant passages and unanswerable questions.
For the broader testing question, see AI benchmarks and task success. Geometry helps organize a search. Whether the search supports a correct, complete answer remains an empirical question.
Sources and methodology
The cosine and dot-product definitions were checked against Google's embedding-similarity documentation on October 19, 2026. Its publication/update date was not established in the retrieved text. The vectors, calculations and proposed evaluation procedure are WorldLensia's original teaching example and analysis, not measured retrieval results.
To separate retrieval ranking from probability calibration, see RAG Retrieval Evaluation: Check the Evidence Before Grading the Answer and AI Probability Calibration: Does an 80% Score Mean What You Think?.