
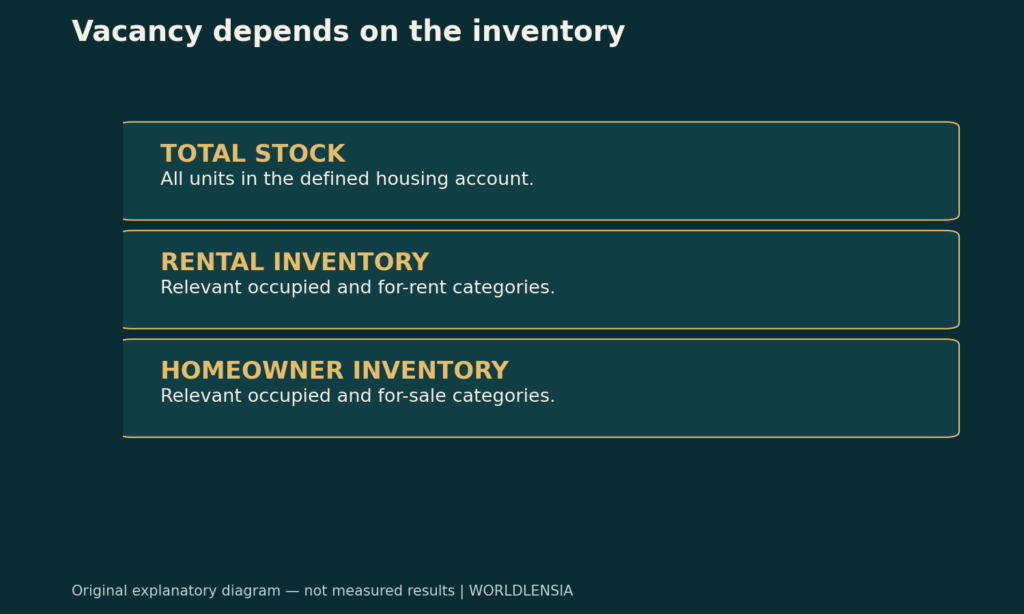
A vacancy rate depends on which housing inventory is measured. In one fictional town, the total vacancy share is 10%, the rental vacancy rate about 9.1% and the homeowner vacancy rate about 2.4%; these values can all be consistent. Each statistic can use a different relevant inventory. The denominator is part of the measure, not an interchangeable background number.
This matters when a headline treats every unoccupied housing unit as an available home. Some units are offered for rent, some for sale only, some already rented or sold but not yet occupied, and others held off the market or used seasonally. Those categories do not answer the same market-availability question.

Start with the housing-unit universe
Before calculating a vacancy rate, identify what the source counts as a housing unit and which units belong in the selected inventory. A living arrangement can fall outside a particular housing-unit definition, and an empty structure is not automatically included in the same way as a usable vacant home.
The Census Housing Vacancy Survey definitions describe the categories and their boundaries. Use those definitions for an HVS comparison rather than creating a personal interpretation of “empty.” Other datasets can use different universes, so the source name remains essential.
For a local article, confirm that the measure actually covers the stated geography. A national definition does not supply a current city estimate, and a regional rate should not be relabeled as a neighborhood rate.
Occupied and vacant is only the first split
An inventory account can begin by separating occupied units from vacant units under the source's rules. The vacant side then needs further classification. A for-rent unit is not the same as a seasonal unit or one withheld from the market for another reason.
Some units can be both for rent and for sale, and the source specifies how they are classified. Units already rented or sold but awaiting occupancy also need their stated treatment. These details can affect the relevant denominator and should not be simplified away in an actual reconstruction.
Do not infer availability solely from the absence of a resident at the moment of observation. The market question requires the unit's status, not just an occupancy snapshot.
A fictional town with a complete account
Imagine a town containing 1,000 housing units in a deliberately simplified teaching account. It has 500 occupied rental units, 400 owner-occupied units, 50 vacant units offered for rent and 10 vacant units for sale only.
The remaining 40 are other vacant units held off the market or seasonal. There are no units already rented or sold and awaiting occupancy in this example, and no mixed-status complications are introduced.
| Synthetic housing category | Units |
|---|---|
| Occupied rental | 500 |
| Owner occupied | 400 |
| Vacant for rent | 50 |
| Vacant for sale only | 10 |
| Other vacant or seasonal, outside these market inventories | 40 |
| Total | 1,000 |
These are invented counts, not an estimate for a real place. The simplified categories are chosen to isolate the denominator issue. A real HVS reconstruction must follow the complete published definitions, including any rented-or-sold units awaiting occupancy.
There are 100 vacant units in the fictional total account: 50+10+40. Dividing by all 1,000 units gives a total vacancy share of 10%.
That fraction answers how much of this simplified total inventory is vacant under the example's categories. It does not say that 100 homes are available to rent, nor that 100 are available to buy.
The distinction should remain in the wording. Calling the result “the vacancy rate” without a qualifier can encourage readers to assume it is the rental-market measure they have seen elsewhere.
Calculate the rental vacancy rate
For the simplified rental inventory, combine the 500 occupied rental units with the 50 vacant units offered for rent. The relevant inventory is 550. The for-rent vacant portion is 50÷550, approximately 9.09%.
The 400 owner-occupied homes do not belong in that denominator. Neither do the ten for-sale-only vacancies or the forty other/seasonal vacancies in this example. Adding them would change the question from rental-market vacancy to another inventory share.
A rental rate is therefore not obtained by dividing vacant rental units by every housing unit in town. The numerator and denominator must describe the same relevant market account.
Calculate the homeowner vacancy rate
For the simplified homeowner inventory, combine the 400 owner-occupied units and the ten units for sale only. The relevant inventory is 410. The for-sale-only vacant portion is 10÷410, approximately 2.44%.
This is not the same denominator as the rental calculation, and it is not a measure of every listing a buyer might encounter under every real-estate data source. The example follows a narrow inventory construction to demonstrate the distinction.
| Synthetic measure | Calculation | Result |
|---|---|---|
| Total vacancy share | 100 ÷ 1,000 | 10.00% |
| Rental vacancy rate | 50 ÷ 550 | About 9.09% |
| Homeowner vacancy rate | 10 ÷ 410 | About 2.44% |
All three can be correct because their denominators and intended interpretations differ. A comparison that drops the measure names creates the apparent contradiction.
Other vacancy is not automatically usable supply
A seasonal unit, a unit held for occasional use and another off-market unit can have different reasons for being vacant. The fact that they are not occupied does not establish that they can be leased or sold immediately under ordinary conditions.
Do not turn a statistical category into a claim about an individual owner's intentions. A source may provide only an aggregate classification. Explaining why particular units are unavailable requires additional evidence.
Likewise, do not assume that all off-market units are permanently unavailable. Status can change. The point is that the current inventory measure should not silently treat every vacant unit as current market supply.
Vacant, listed and available are not universal synonyms
A listing database can count advertised properties under its own rules. A survey can classify units by occupancy and market status. A property can also be pending or otherwise in transition. These systems need not count the same objects at the same time.
Before comparing a listing total with an HVS rate, inspect the listing source's unit, geography, date and treatment of duplicates or relistings. A listing for a whole building is not necessarily the same as a housing-unit record.
An empirical article can use both sources, but it should explain the relationship rather than forcing one to validate the other. Agreement is not guaranteed, and disagreement is not automatically evidence that one source is wrong.
A rate can change through its denominator
Suppose the fictional town's for-rent vacancies remain at 50 while occupied rental units rise from 500 to 550. Under the simplified account, rental inventory becomes 600 and the rate falls to about 8.33%.
The vacant count did not fall. The ratio changed because the relevant inventory increased. That is why a trend paragraph should inspect counts and denominators rather than describing every decline as fewer empty homes.
The reverse can occur when occupied inventory changes in the other direction. For a real series, check which categories moved and whether revisions or classification changes affect the comparison.
Conversions can affect more than one account
A unit moving from rental to owner occupancy can alter the rental and homeowner inventories. A change from seasonal use to a for-rent offering can affect market availability without adding a new structure. Those are different mechanisms from new construction.
Do not infer a construction boom from an inventory change without checking the source components. Likewise, a change in a rental rate does not identify whether it came from household formation, conversions, status changes or another cause.
Use the aggregate account to formulate questions, then investigate the relevant evidence. A ratio alone rarely identifies the complete mechanism behind its movement.
Geography can change the comparison
A city proper, county and metropolitan area describe different boundaries. Their housing inventories and populations can differ substantially. Two correctly measured vacancy rates may therefore answer different geographic questions.
WorldLensia's city-versus-metro guide explains that boundary issue. Match the area before comparing, and read historical notes when boundaries are revised.
The captured HVS definitions include notes about geographic comparability across delineation periods. For an actual time series, use the relevant vintage-specific guidance rather than assuming a familiar place name guarantees an unchanged boundary.
Survey uncertainty remains relevant
A sample-based estimate is not the same as a complete count of every unit. Where the source provides uncertainty information, preserve it and use the appropriate comparison method. A small difference between displayed rates may not support a confident ranking.
Do not borrow an uncertainty formula from an unrelated survey without justification. Use the HVS method and documentation for an HVS estimate. If the necessary information is unavailable, state the limitation.
Rounding also matters. Two places displayed at one decimal place may have different unrounded values, but the extra digits do not eliminate sampling and other limitations. Precision should fit the evidence.

Vacancy is not a complete affordability measure
A vacancy rate does not directly state the rent a household will pay, the condition of available units or whether they match the household's needs. Market availability and affordability are related questions, but they require different inputs.
The city-rent comparison guide distinguishes asking, contract and gross rent. Combining the wrong rent definition with a vacancy rate can create a story that neither measure supports.
For a real affordability comparison, identify the rent measure, income denominator, unit characteristics and observation period. Do not treat a single vacancy percentage as an automatic verdict that housing is cheap or expensive.
Property-level vacancy is another scale
A landlord's vacancy assumption in a property scenario may refer to lost rent or time without an occupied unit. That is not automatically the same as a market survey's point-in-time vacancy rate.
The cap-rate and cash-on-cash guide separates property operating assumptions from financing. A market statistic can inform context, but it should not be copied into a property cash-flow model without checking its meaning.
For example, a share of units vacant at a survey date is not directly a percentage of annual rent lost by one building. The connection depends on turnover, duration, rent collection and other details that need evidence.
Avoid causal claims from a two-place comparison
If one place has a higher rental vacancy rate than another, the comparison does not by itself explain why. Differences in housing mix, geography, economic conditions, timing or measurement may matter. Establishing a cause requires a suitable design and supporting data.
Do not infer that a policy succeeded or failed from one cross-sectional rate alone. State the descriptive finding first, preserve the uncertainty and identify the evidence needed to evaluate the proposed explanation.
This restraint does not make the statistic unhelpful. It makes the next research question more precise and prevents the measure from carrying a conclusion it was not designed to establish.
Build an inventory reconciliation before the headline
For a real dataset, list the total housing universe and its published categories. Check that the selected counts reconcile under the source's definitions and note any residual or unavailable category. Keep the raw values and the calculation separate.
Record the source table, release date, observation period, geography, unit and uncertainty information. For each rate, write the numerator and denominator in words as well as symbols. This exposes a mismatch before it becomes a chart.
If a necessary category is missing, do not quietly assign it to zero. Obtain the proper table or qualify the calculation. A complete-looking inventory built from an unsupported assumption is less useful than an honestly incomplete one.
Choose a chart that preserves the categories
A housing-stock diagram can show occupied rental, owner-occupied and the relevant vacancy statuses. A separate rate table can then identify each denominator. That is clearer than placing three percentages beside one another with the same generic “vacancy” label.
If a stacked chart is used, ensure the categories are mutually exclusive and cover the stated total under the source's rules. Do not stack overlapping categories or mix counts with percentages without explanation.
For the fictional town, the inventory adds to 1,000 and the three rates are derived from explicitly different totals. The visual should preserve that relationship rather than making the percentages appear to be competing estimates of one quantity.
A careful reporting paragraph
A precise account of the fictional example says that 100 of 1,000 units are vacant in total, while the simplified rental and homeowner inventories produce rates of about 9.09% and 2.44%. It then identifies the off-market or seasonal units excluded from those two market inventories.
For real data, use the publisher's exact measure names and note important comparability limits. Avoid translating “vacant” into “available to every household” or interpreting a survey rate as an individual property's expected downtime.
The central lesson is that a housing statistic is an account of a defined inventory. Once the categories, time and geography are visible, the different rates can be read together without inventing a contradiction.
A transition worksheet can explain change without guessing causes
For a real time comparison, track additions, removals and status changes where the source permits. New construction, demolition, conversion and movement between vacancy categories can affect the account differently. A rate difference alone does not identify which transition occurred.
Keep the beginning and ending inventories separate from the flows used to reconcile them. If the flows are incomplete, report the residual as unresolved rather than assigning it to a convenient category. The worksheet should reveal missing information, not hide it.
For the fictional town, no transitions were observed. The alternative denominator scenario is a modeled change, not a history. Labeling that status prevents the illustration from being mistaken for a measured local development.
Seasonal use deserves its own explanation
A seasonal unit may be vacant at one observation date while serving a use at another time. That does not make it equivalent to a year-round rental vacancy. The source's classification is designed to preserve that distinction.
When reporting a place with substantial seasonal housing, describe the relevant categories rather than using the total vacancy share as a direct measure of the year-round rental market. Do not infer the owners' motivations or the ease of conversion without evidence.
A policy discussion can ask whether some units could become available, but that is a separate scenario. It requires legal, physical, economic and behavioral information beyond the occupancy count. The statistical table alone does not establish how many conversions would occur.
A new household and a new housing unit are different events
Household formation can change occupancy without adding a structure. A new unit can be completed before it becomes occupied. Those events can affect the vacancy account at different times.
Do not compare a construction announcement directly with a household count and call the difference a measured vacancy change. Match the observation dates and the definitions of completion, occupancy and household status.
For a supply-pipeline article, connect the stages with verified data rather than treating permits, starts, completions and available units as interchangeable. Each stage answers a different question about the housing system.
Keep survey and administrative evidence in their roles
A survey estimate, a utility-account count and a listing database may each provide useful information, but they have different coverage and status rules. A disconnected utility is not automatically a vacant housing unit, and an active listing is not automatically an unoccupied one.
When using multiple sources, write down what each directly observes and what inference connects it to vacancy. Validate that inference where possible. Do not describe a proxy as a complete count merely because it is available at finer geographic detail.
If the sources disagree, examine scope, dates and methods before averaging them. A numerical compromise can conceal the fact that the sources measure different populations.
A local ranking needs a defensible comparison rule
Before ranking places, establish compatible measures, boundaries and time periods. Keep uncertainty and missing estimates visible. A list ordered by rounded percentages can imply more precision than the source supports.
If the purpose is to identify places for further investigation, say so. A screening list is not a causal explanation or an assessment of an individual property's prospects. The statistical result should remain separate from a recommendation that requires more information.
For the fictional town, no ranking is supplied because there is only one invented inventory. The example teaches denominator selection, not which market a reader should enter or leave.
State when a denominator is an assumption
In a scenario model, the analyst can deliberately hold some categories fixed and change another. That is useful for understanding the ratio's sensitivity. It is different from a published denominator measured by a survey.
Label the held-fixed assumptions and avoid presenting the scenario as a prediction. If occupied rentals rise in the model, the arithmetic shows the resulting rate under that assumption; it does not establish that the rise will happen.
This distinction makes sensitivity analysis useful without turning it into invented market evidence. Readers can see both the conditional result and the information needed for a real application.
Keep the example's simplification visible
The fictional town intentionally excludes transitional rented-or-sold units awaiting occupancy. That choice makes the arithmetic transparent; it is not a claim that those categories never matter in real housing inventories.
Sources and methodology
Definitions and comparability notes were checked against the Census Housing Vacancy Survey Definitions and Explanations on October 19, 2026. The captured document references 2026 geographic changes; its publication/update date was not established. All town counts, rates and change scenarios are original hypothetical teaching examples. They are not current housing-market estimates, property forecasts or financial advice.
To connect the inventory definition with rent and sales-pace measures, see Comparing City Rents: Asking Rent, Contract Rent and Gross Rent Answer Different Questions and Months Supply Is Not a Forecast of How Long a Home Will Take to Sell.