
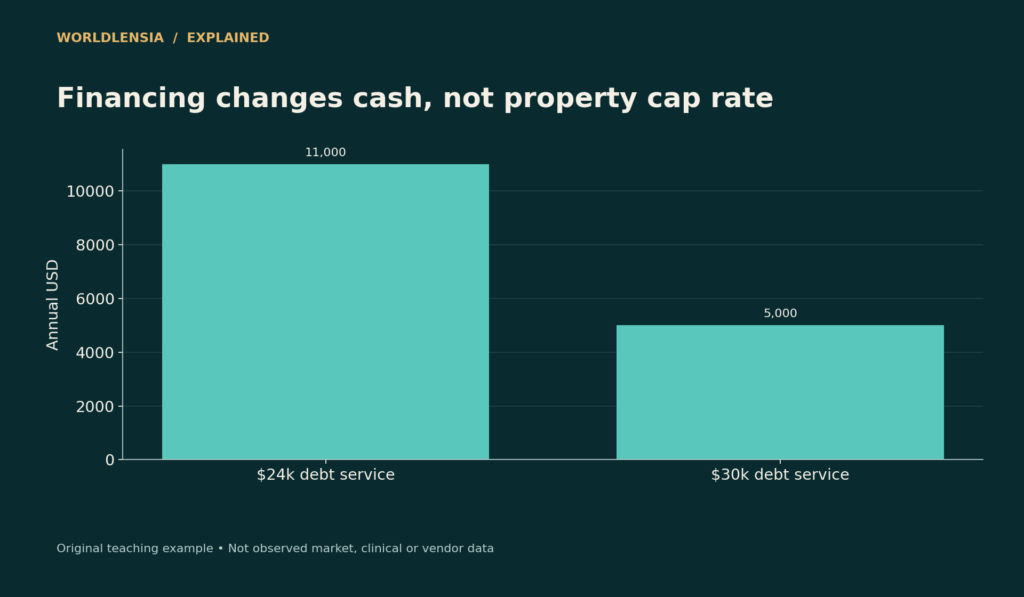
A property's capitalization rate and an investor's cash-on-cash return can move differently because they describe different layers of the transaction. Cap rate relates net operating income to property value or price. A cash-on-cash measure relates a defined cash flow to the investor's cash invested, with financing and other adjustments depending on the stated convention.
Nareit's glossary defines cap rate using net operating income and value or purchase price, and distinguishes trailing and forward income conventions. A cap-rate comparison is useful only if the income and denominator definitions match. It is not a guaranteed return or a complete investment assessment.
Cap Rate: Begin with operating income
Suppose a fictional property has annual potential rent of $60,000, vacancy and collection losses of $3,000, and operating expenses of $22,000. Under this simplified definition, net operating income is $35,000. At a $500,000 price, the cap rate is 7%.
| Item | Illustrative annual amount |
|---|---|
| Potential rent | $60,000 |
| Vacancy/collection losses | −$3,000 |
| Operating expenses | −$22,000 |
| Net operating income | $35,000 |
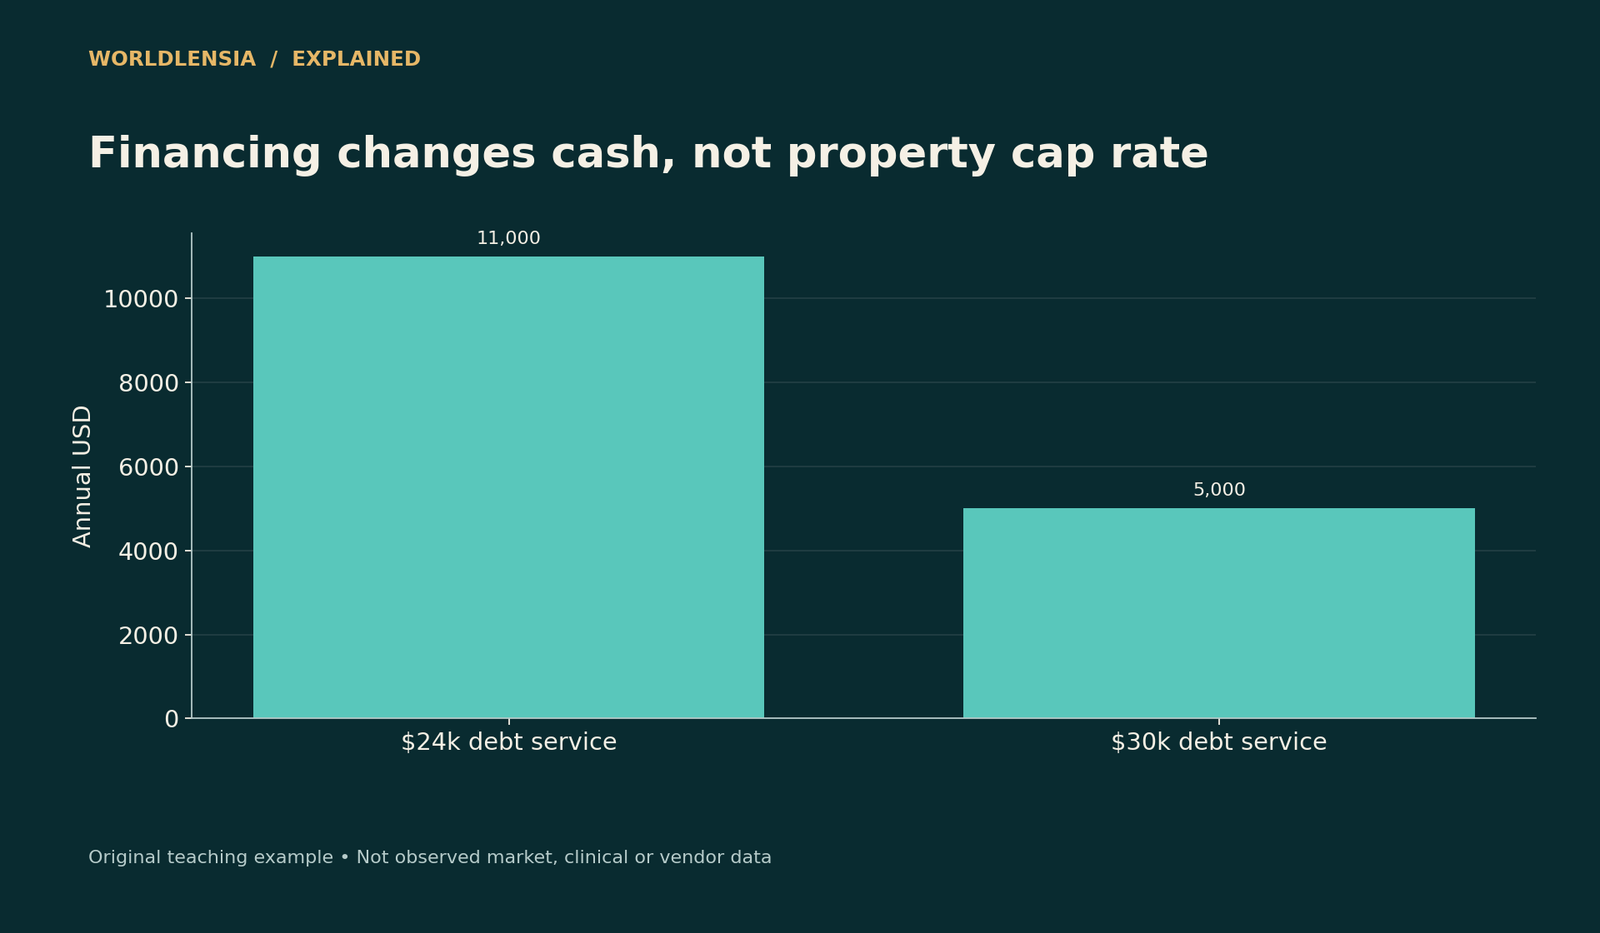
Figure data and assumptions
Original hypothetical teaching data; see the caption and article for assumptions.
| Category | Simplified cash after debt |
|---|---|
| $24k debt service | 11000.0 |
| $30k debt service | 5000.0 |
The definition must state which operating expenses are included. Do not use gross rent in the numerator and call the result a cap rate. A gross-rent yield is another measure.
Add financing separately
Assume annual debt service of $24,000. Subtracting it from NOI leaves $11,000 before any additional cash adjustments. If cash invested is $150,000, that simplified cash-on-cash figure is about 7.33%.
Now increase annual debt service to $30,000 while keeping the property, price, NOI, and cash-invested denominator unchanged. The remaining cash is $5,000, or 3.33%. The cap rate remains 7%. The property-level income relationship has not changed; the financing cash burden has.
These assumptions are illustrative and are not a real loan quote. A complete investment model must define acquisition costs, reserves, capital spending, debt terms, and tax treatment consistently.
Capital expenditure needs explicit treatment
A major roof replacement can reduce available cash without appearing in a simplified NOI definition in the same way as a routine operating expense. Accounting and valuation conventions vary, so read the method rather than assuming the numerator covers every cash need.
If the example needs a $10,000 capital outlay, the $11,000 post-debt amount leaves only $1,000 before other adjustments. A comparison that ignores the expenditure can greatly overstate distributable cash. Do not count a reserve and the same spending twice without reconciling the cash account.
Trailing and forward income differ
Trailing NOI uses a historical period. Forward or stabilized NOI estimates a future or normalized operating condition. A property advertised with projected full occupancy should not be compared casually with another's actual recent income.
Ask what supports rent growth, occupancy, expenses, and concessions. A forward figure can be useful, but it is an assumption-dependent estimate. Label it and test alternatives. A high projected cap rate can reflect optimistic inputs rather than a low purchase price.
Valuation is sensitive to the rate
Holding $35,000 of NOI constant, dividing by 6% implies about $583,333, by 7% implies $500,000, and by 8% implies $437,500. The relationship is inverse and nonlinear. A one-percentage-point change is not a one-percent change in implied value.
The accompanying chart is a mathematical sensitivity illustration, not an appraisal. An appropriate rate depends on market evidence and property-specific conditions. A direct-capitalization shortcut may be unsuitable when income is unstable or requires a detailed transition to stabilization.
A high rate is not automatically a bargain
Lower price relative to income can reflect higher perceived risk, weak growth prospects, building condition, location, or unreliable income. Two equal cap rates can also conceal different lease terms, tenant concentrations, and future expenses.
Inspect the source records and assumptions rather than selecting the highest number in a listing table. A ratio cannot establish the quality of the underlying rent roll or the cost of deferred work.
Build the cash-invested denominator carefully
The cash invested can include the down payment, acquisition charges, initial repair spending, and reserves under the chosen definition. Two presentations can report different cash-on-cash rates for the same property because they include different items in this denominator.
Suppose the investor contributes $150,000 for the transaction and another $20,000 for initial work. If the relevant denominator is $170,000, an $11,000 annual cash flow represents about 6.47%, not 7.33%. Neither arithmetic result is mysterious; the difference is what cash was counted.
Publish the denominator bridge rather than selecting the convention that produces the highest return. A reserve retained in cash should also be tracked as an asset and reconciled with distributions and spending. The model should explain where the funds sit and when they become an expense.
Debt can improve or weaken the cash result
Borrowing reduces the initial equity needed but introduces debt service and other financing obligations. Depending on income, price, rates, amortization, fees, and cash invested, the effect on a cash-on-cash ratio can be favorable or unfavorable. It is not an automatic improvement.
Principal repayment also has two roles: it uses cash and reduces debt. A cash-on-cash measure focused on distributable cash generally does not treat that reduction as an immediate cash distribution. A total-return analysis may consider the equity effect separately. State the measure rather than mixing the treatments.
Do not compare an unlevered property yield with a leveraged investor return and attribute the entire difference to superior property performance. The financing structure changed. A useful table keeps property income, debt payments, cash distributions, and debt reduction on separate lines.
Vacancy is a cash assumption, not just a percentage
A property can lose income through empty space, nonpayment, concessions, or downtime during work. Specify what the vacancy and collection allowance covers. If gross potential rent already reflects concessions, subtracting the same concession again can understate income.
In the original example, increasing vacancy and collection losses from $3,000 to $9,000 reduces NOI from $35,000 to $29,000 if other inputs stay fixed. At a $500,000 price, the cap rate becomes 5.8%. After $24,000 debt service, the simplified pre-capital cash amount is $5,000.
This illustrates how a moderate income change can have a much larger proportional effect on cash remaining after a fixed debt payment. It does not estimate a real property's vacancy risk. Obtain a rent roll, payment history, lease information, and appropriate market evidence for that question.
Expense assumptions can be stale
A seller's historical operating expenses may not equal a buyer's future costs. Insurance, taxes, management arrangements, utilities, and repairs can change. Reconcile each assumption against available records and property-specific estimates.
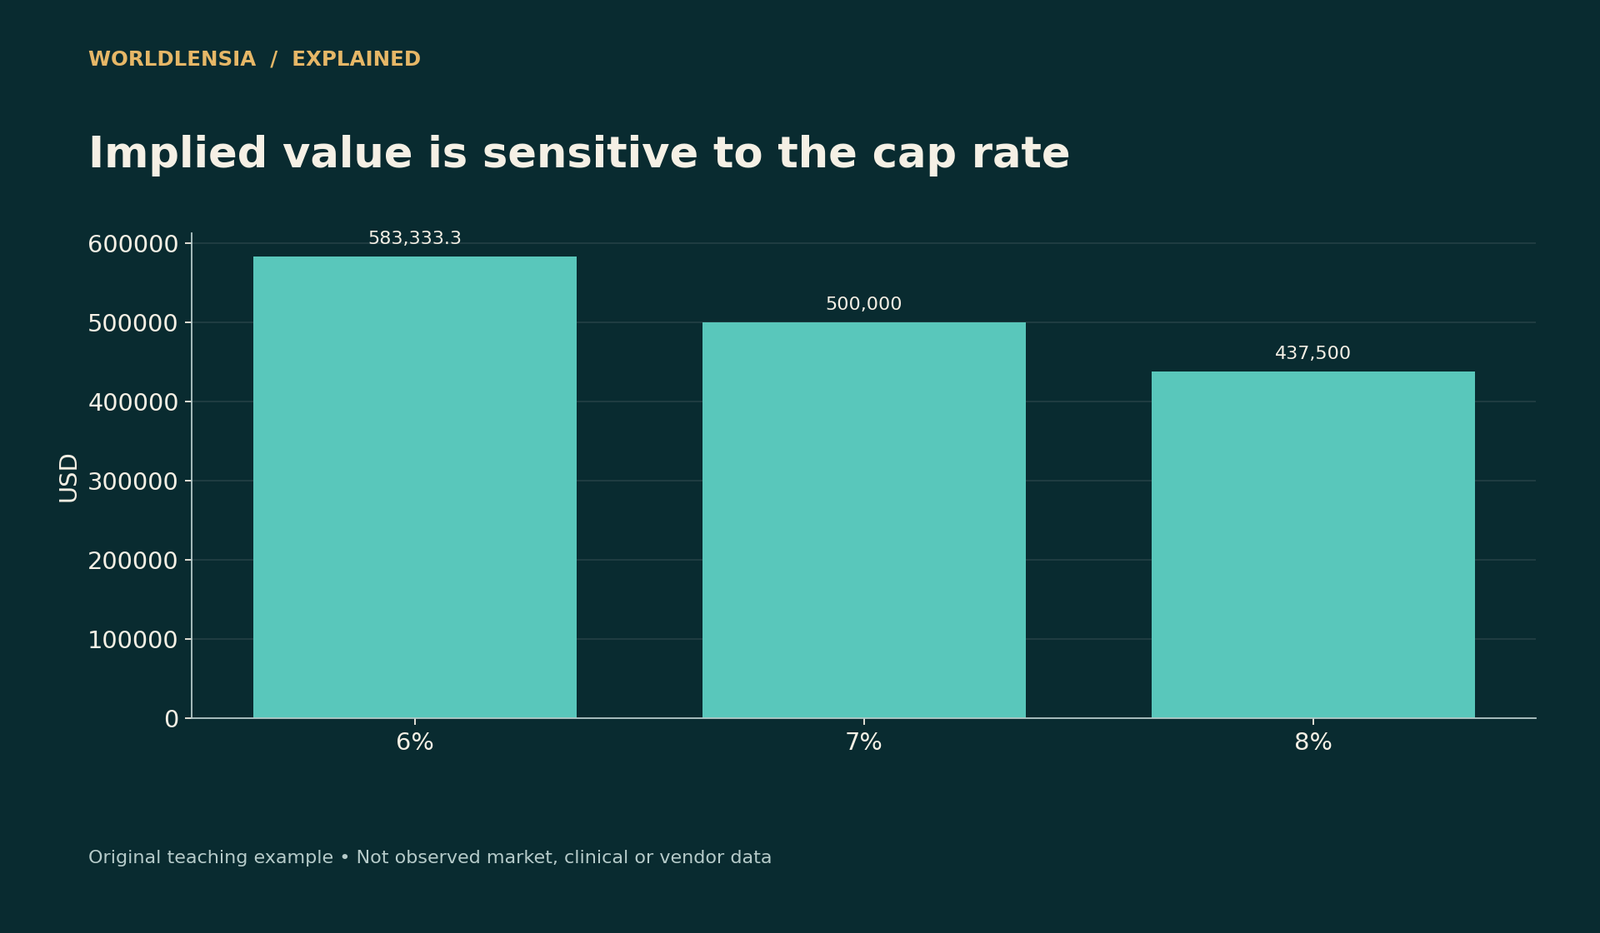
Figure data and assumptions
Original hypothetical teaching data; see the caption and article for assumptions.
| Category | Implied value |
|---|---|
| 6% | 583333.3333333334 |
| 7% | 499999.99999999994 |
| 8% | 437500.0 |
Owner labor can also be omitted from an informal statement. A property managed personally may appear to have lower cash expenses while still requiring substantial work. An investor comparing it with a professionally managed alternative should make that difference explicit.
Do not fill missing records with an invented industry percentage. An assumption can be used for sensitivity, but it must be identified as such. A polished pro forma is not evidence that the expense forecast has been independently verified.
Compare values at the same income basis
Using a forward cap rate for one property and a trailing cap rate for another can reward an optimistic forecast. If possible, show both on comparable definitions. If not, explain the mismatch and avoid a definitive ranking based on the two labels alone.
For a property under renovation, current income may be temporarily low while future stabilized income is uncertain. Directly dividing a projected stabilized NOI by today's price hides the time and cash needed to reach that condition. Include those transition requirements in a fuller model.
Federal Reserve valuation guidance discusses the limitations of direct capitalization when income is not representative of a stable stream. The article's simplified sensitivity chart therefore does not attempt to value a distressed or partially completed project.
Exit assumptions can dominate total return
An annual cap rate does not include every future sale outcome. A multi-year total-return analysis requires cash flows over time, capital spending, debt balances, selling expenses, and an exit-value assumption. Changes in any of them can alter the result materially.
If a model assumes both rising NOI and a more favorable exit cap rate, the projected value can benefit from two optimistic changes at once. Show each effect separately. Holding one fixed helps readers understand what drives the forecast.
Conversely, a higher exit cap rate can lower implied value even if NOI grows. A property generating more income is not guaranteed to sell for more if the earnings-to-price relationship changes. This is a sensitivity insight, not a prediction of future market rates.
Cash-flow timing affects interpretation
A cash-on-cash measure for one year may include a full year's income even if the investment was funded partway through the year, depending on presentation. Avoid comparing such values without aligning the time period and annualization method.
For irregular cash flows, a time-sensitive investment measure may be appropriate, but it has its own assumptions and limitations. A simple annual ratio should not be represented as equivalent to a multi-year internal rate of return.
Keep the objective clear: current cash distribution, operating yield, debt reduction, or total wealth change. A measure can answer one of those questions well while leaving the others open.
A downside worksheet
Construct alternatives for lower rent collection, higher operating expenses, a major capital repair, and changed financing terms where relevant. Calculate NOI first, then debt service, then capital and reserve cash effects. Keep the cash-invested denominator visible.
For example, the $29,000 NOI scenario with $24,000 debt service leaves $5,000 before capital spending. Adding a $10,000 cash repair creates a $5,000 funding gap under the simplified model. A positive cap rate did not prevent a cash shortfall.
The response could involve reserves, additional contributions, operational changes, or other actions depending on the actual situation. This general article does not recommend a financing remedy. It shows the information a decision-maker needs before assuming a yield covers all obligations.
Distinguish the source from the analyst's assumptions
An appraisal, listing, lender worksheet, and investor model can use different income and expense conventions. Identify which document supplies each input. If you replace a source value with an assumption, preserve the change and its reason.
When sharing a comparison, retain a calculation table and the supporting dates. A cap rate described as current should have a current price or value basis and a clearly identified income period. A ratio built from historical price and forecast income is a different construct.
This discipline also helps when an earlier conclusion changes. Readers can see whether operating performance weakened, financing changed, a missing expense was added, or the valuation assumption moved. The ratio alone cannot explain its own history.
Reconcile a property statement before using the ratio
Begin with rent actually billed and collected, then distinguish concessions, nonpayment, reimbursements, and other income. Compare the statement with supporting records appropriate to the transaction. A total labeled “income” may combine items that should be treated differently in an operating analysis.
Next review expenses by category and period. An unusually low repair year can be real without representing the long-run requirement. An exceptional repair can also make one trailing year unrepresentative. A normalized estimate needs evidence and should be labeled as an analyst adjustment rather than presented as the original statement.
Keep a bridge between reported and adjusted NOI. For each adjustment, show the amount, reason, source, and uncertainty. This makes it possible for another reviewer to disagree with an assumption without having to reconstruct the entire model.
Use comparable properties with caution
A nearby sale may differ in condition, lease length, tenant quality, location, or capital requirements. The observed price and income relationship can be informative, but it does not automatically supply the correct cap rate for every property in the area.
Match the income convention too. A sale described using projected stabilized income cannot be compared directly with another using actual trailing income without adjustment. If the necessary details are unavailable, describe the evidence as limited rather than assigning a precise market rate.
A useful comparison table records the differences that could affect interpretation. The goal is not to eliminate judgment but to show what the judgment rests on. A large collection of poorly matched examples is not necessarily stronger than a smaller set with clear documentation.
Compare full scenarios
Use a consistent worksheet: purchase price, acquisition cash, NOI definition, trailing versus forward period, debt service, capital spending, reserves, taxes if modeled, and exit assumptions. Then compare both cash needs and potential outcomes under adverse conditions.
WorldLensia's rent-versus-buy guide covers the related distinction between cash outflows and equity. The practical principle is the same: keep operating performance, financing, asset value, and investor cash separate before recombining them in a clearly defined model.
Check a debt-coverage measure separately
NOI divided by annual debt service is another defined ratio, often used to discuss the relationship between operating income and scheduled debt payments. In the fictional base case, $35,000 divided by $24,000 is about 1.46. With $29,000 of NOI it is about 1.21. Those values do not establish compliance with any actual lender requirement. The applicable income definition and financing agreement matter. The ratio also does not automatically include capital spending or every investor cash need. Show it as an additional perspective rather than replacing the cash-flow worksheet. A property can have operating income above debt service while still needing extra cash for repairs. Conversely, a reserve can cover a temporary gap without making the underlying long-run economics sound. Keep the reason for the gap visible. These examples demonstrate the value of separate measures: cap rate relates income to price, debt coverage relates income to a payment obligation, and cash-on-cash relates a defined cash amount to invested cash. None should be relabeled as the others.
A positive annual cash return does not establish that every month has positive cash flow. Seasonal income and large repair payments can create temporary funding needs. A monthly schedule can expose those gaps even when the annual total remains positive. Keep that timing evidence beside the yearly ratio when liquidity is important.
Sources and methodology
Nareit's cap-rate glossary and Federal Reserve real-estate valuation guidance were checked October 18, 2026. All property figures and sensitivity calculations are original hypothetical examples, not investment recommendations, market cap rates, or an appraisal.
- Nareit: Capitalization rate — checked October 18, 2026.
- Federal Reserve: Real-estate valuation guidance — checked October 18, 2026.
Continue with Revenue, profit and cash flow and House-price indicators and budgets for related context.
To compare property cash flow with ownership scenarios and vacancy definitions, see Rent vs Buy: Compare Cash, Equity and Risk on the Same Timeline and Rental and Homeowner Vacancy Rates Use Different Inventories.