
The cash conversion cycle shows how long cash is tied up between paying for inputs and collecting from customers. A retailer can sell more and still need extra cash if it pays for stock long before customers pay. The measure connects operating decisions to funding needs without treating accounting profit as cash already collected.
At a glance
- The cycle combines inventory days and collection days, less supplier-payment days.
- Use comparable periods and clearly defined inputs.
- A shorter cycle is not proof of better service or lower risk.
Follow the cash through the business
BDC describes the cash conversion cycle as a tool for examining how quickly a business turns its investment in operations back into cash. A timing analysis builds on that distinction. Inventory may be bought before a sale, and a recognized sale may become a receivable before cash arrives.
The teaching formula is inventory days plus receivable days minus payable days. It is a management approximation, not a replacement for the cash-flow statement. Different businesses and analysts may define the component ratios differently, so show the inputs.
A fictional 45-day cycle
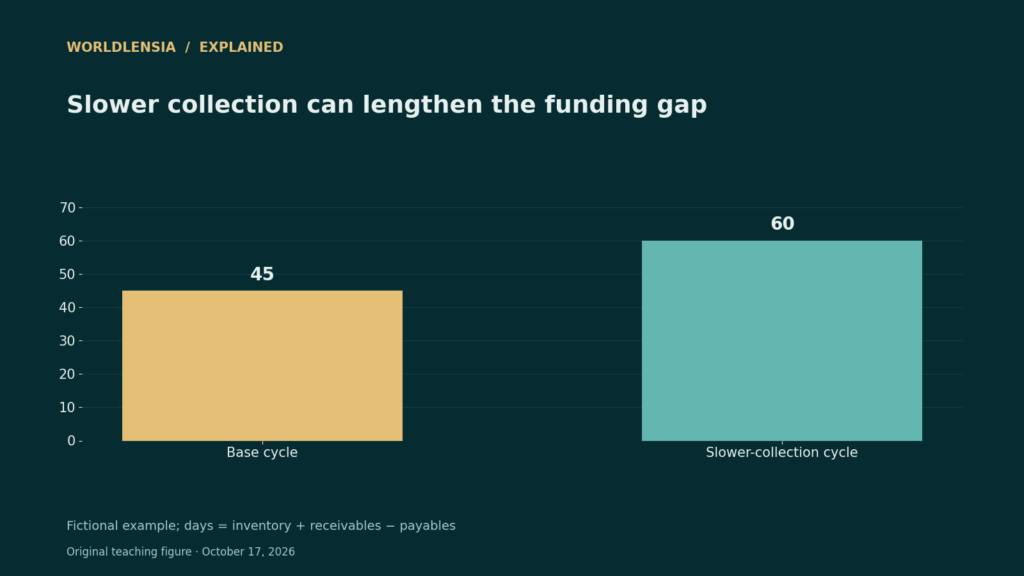
Imagine a distributor holds inventory for 60 days, collects customer invoices 30 days after sale, and pays suppliers after 45 days. The illustrative cycle is 60 plus 30 minus 45, or 45 days. The business must bridge that timing using its available cash and financing arrangements.
If collection takes 45 days instead of 30, the cycle lengthens to 60 days with the other assumptions unchanged. More sales can then mean more cash tied up in unpaid invoices. The arithmetic illustrates a mechanism; it is not a forecast of a particular business’s bank balance.
Do not optimize one number blindly
Extending payment delays may reduce the calculated cycle while damaging supplier relationships or violating agreed terms. Cutting inventory may reduce funding needs while increasing stockouts. The right operational decision depends on service requirements and actual contracts.
Review collections, supplier terms, inventory availability, and cash forecasts together. For seasonal businesses, annual averages can hide peak funding needs. A weekly cash forecast can reveal a shortfall that a favorable annual ratio misses.
A practical comparison
| Fictional component | Base case | Slower collections |
|---|---|---|
| Inventory days | 60 | 60 |
| Receivable days | 30 | 45 |
| Payable days | 45 | 45 |
| Cash conversion cycle | 45 days | 60 days |
Before using the result
- Disclose component definitions.
- Examine peak periods as well as annual averages.
- Do not confuse delayed payment with free cash generation.
Continue exploring: our business and industry research.
Sources and methodology
Reviewed October 17, 2026. WorldLensia explanatory analysis. Worked examples and the accompanying teaching figure are illustrative, not measured findings or product tests. Consult the linked source for definitions and revisions.
To connect receivable timing with payment terms and available cash, see 2/10 Net 30 Payment Terms: Formula, Examples, and Due Dates and Cash Runway: Replace One Burn Rate with a Dated Cash Forecast.