
An AI feature can feel slow even when the language model is fast. A request may wait for document retrieval, a database, a second model call, or a review step. Measuring only one component can encourage expensive changes that barely affect the user's actual wait.
The useful starting point is an end-to-end timeline. Record when the user submits the task, when the first useful information appears, when the complete response arrives, and when the requested job is actually finished. These timestamps answer different questions.
OpenAI's latency-optimization guidance discusses reducing unnecessary work, generating fewer tokens where appropriate, and using ordinary application techniques. The framework below applies those ideas through original fictional examples rather than presenting vendor performance claims.
Separate first response from completion
Time to first token describes the start of generation, not the delivery of a usable answer. Streaming can improve the experience of reading a long answer, but a user who needs a complete table cannot act on its first word. Measure time to a useful result as well.
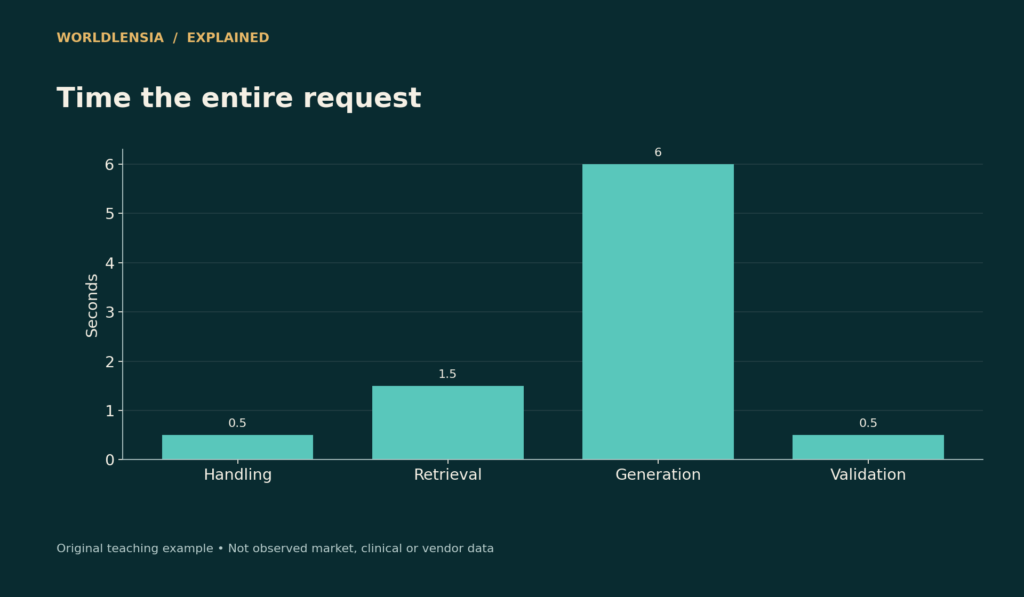
Suppose a request takes 0.5 seconds to enter the service, 1.5 for retrieval, 6 for generation, and 0.5 for validation. With no overlap, total time is 8.5 seconds. Cutting retrieval in half saves 0.75 seconds. Cutting generation in half saves 3 seconds. These are arithmetic consequences of the assumptions, not observed benchmarks.
| Stage | Illustrative duration | Share of 8.5-second total |
|---|---|---|
| Request handling | 0.5 s | 5.9% |
| Retrieval | 1.5 s | 17.6% |
| Generation | 6.0 s | 70.6% |
| Validation | 0.5 s | 5.9% |

Figure data and assumptions
Original hypothetical teaching data; see the caption and article for assumptions.
| Category | Duration |
|---|---|
| Handling | 0.5 |
| Retrieval | 1.5 |
| Generation | 6.0 |
| Validation | 0.5 |
If retrieval becomes faster but the final response remains long, the improvement may be hard to notice. In a different service dominated by database queries, the priorities would reverse. Measure the particular workflow.
Compare serial and parallel work correctly
If three independent lookups take one, two, and three seconds, serial execution takes six seconds before overhead. Ideal parallel execution takes roughly three, plus coordination and any resource contention. Parallelism is useful only when the tasks really are independent and the service can support concurrent requests.
Do not parallelize steps that depend on earlier results. A query that requires a verified customer identifier cannot safely run before identity resolution completes. Saving time by skipping a necessary dependency changes the behavior of the application.
Count retries and failed requests
A short median response time can hide a painful tail. Report a median and an appropriate high percentile, along with completion rate and sample size. Keep the measurement window and workload consistent across comparisons.
An application that finishes most requests in three seconds but repeatedly times out on large documents may be unsuitable for the very users it was built to serve. Include those documents in the evaluation and report timeouts as outcomes. A timing chart limited to successful requests is incomplete.
Reduce work without reducing usefulness
Some confirmations, fixed labels, and simple arithmetic do not need a generative model. A validated template or direct calculation can be faster and easier to test. Reserve generation for tasks that need it.
Shorter outputs can also help, but evaluate task completion. A 200-word answer that forces three follow-up questions may be slower overall than one clear 500-word answer. Track the number of interactions and the time until the user completes the intended job.
Cache with a freshness rule
Caching can avoid repeating work on identical or similar requests, but a cached answer needs appropriate scope. A public glossary definition and a customer's current account balance have very different freshness and permission requirements.
Record what is cached, for whom, for how long, and what invalidates it. Preserve source dates. Do not reuse a private answer across users simply because their questions look similar. A speed improvement that crosses an access boundary is a defect.
Evaluate smaller or faster configurations
Compare candidates on the same representative tasks. Include factual accuracy, source use, format validity, total cost, and end-to-end latency. A fast response that requires manual correction may create more total work.
Use staged routing only when you can evaluate the routing decision too. If an inexpensive first stage sends difficult cases to a more capable stage, count the combined time and cost for those cases. Report the proportion routed each way so readers can understand the average.
Account for user correction time
Suppose Configuration A returns in four seconds but needs an average of 90 seconds of manual correction on the evaluated tasks. Configuration B returns in ten seconds and needs 20 seconds of correction. Their initial response-time ranking favors A, while the simplified combined times are 94 and 30 seconds.
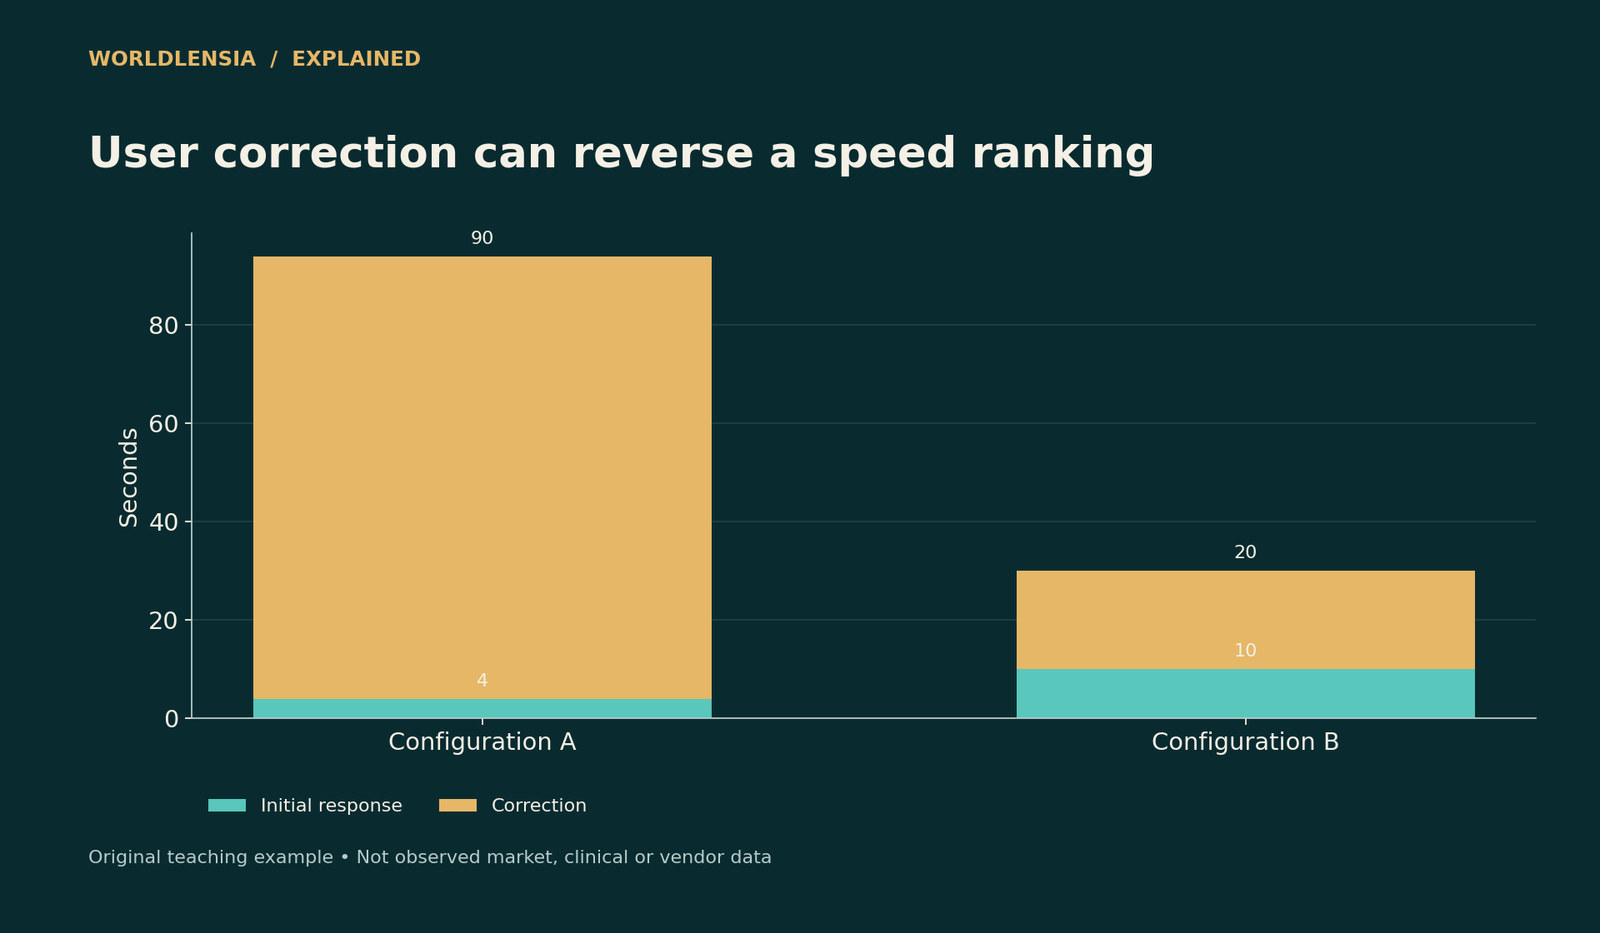
Figure data and assumptions
Original hypothetical teaching data; see the caption and article for assumptions.
| Category | Initial response | Correction |
|---|---|---|
| Configuration A | 4.0 | 90.0 |
| Configuration B | 10.0 | 20.0 |
Those invented averages illustrate why generation speed should be paired with usability. In a real evaluation, record the correction process consistently. Reviewers who know which system produced an answer may have different expectations, so a fair comparison should reduce that influence where practical.
Also count abandonment. If users give up before the result arrives, a timing report limited to completed sessions can miss an important outcome. Define success in terms of the requested job rather than the presence of text on screen.
Distinguish critical and background work
Some actions must finish before a user can proceed; others can happen afterward. A useful interface may display a verified summary while a nonessential export is prepared, provided it clearly shows what remains incomplete. Moving work out of the critical path can reduce waiting without reducing the total work performed.
Do not label a task complete while an essential validation or write is pending. If a user acts on an unvalidated result, the apparent speed improvement may simply shift risk to the user. Define which checks are prerequisites and which are optional enhancements.
For a data-analysis assistant, a chart should not appear final before the underlying calculation succeeds. A temporary progress indicator is more honest than a plausible-looking placeholder that could be mistaken for real data.
Measure concurrency rather than assuming unlimited scale
A service that responds quickly to one request can behave differently when many arrive together. Record the number of simultaneous users or requests, queue times, limits, and backoff behavior. Compare candidates at a load relevant to the intended deployment.
If a system retries aggressively after a temporary limit, it can increase the load and worsen the queue. A measured retry policy with clear failure handling is part of performance engineering. Do not represent repeated attempts as independent successful jobs in the completion count.
Separate client, application, tool, and provider timing where the available evidence permits it. When a component cannot be measured directly, label the estimate rather than inventing a precise internal breakdown.
Use comparable output requirements
A faster answer may simply omit required sections. Freeze the acceptance rubric: for example, a correct comparison table, source links, an explanation of limitations, and a valid file. Then measure how long each system takes to satisfy that rubric.
Output length is not a quality measure by itself. A concise answer can satisfy a focused question, while a complex request may need substantial detail. Compare successful task completion rather than rewarding the shortest response regardless of missing evidence.
Include tool-generated artifacts in the timing. If the chat answer appears quickly but the downloadable file takes several minutes, report both. Users can then see whether the system suits an interactive question, a background batch, or a file-production workflow.
A staged experiment
First capture a representative baseline without optimizing. Next identify the longest measured stage and propose one change. Run the same tasks again, including difficult cases. Compare end-to-end time, quality, completion, cost, and the tail of the distribution.
If the change helps only a subset, report that subset. A retrieval cache may help repeat questions while doing little for new documents. A smaller model may handle simple extraction well but fail on exception-heavy tasks. Routing can be useful, but its errors and overhead must be included.
Finally, keep the previous configuration available until the new one has passed the agreed checks. Performance work should have a rollback path just like other production changes. A few favorable examples are not sufficient evidence to remove a functioning alternative.
Report what users actually wait for
Separate a status message from a result. An immediate “working on it” can reassure users, but it should not be counted as task completion. Record the time to a verified answer or usable artifact as well as the first visible feedback.
For an export workflow, include download readiness and whether the file opens correctly. For a transaction workflow, distinguish preparation from a confirmed external result. These endpoints make the measurement meaningful and prevent an interface improvement from being mistaken for a reduction in the underlying processing time.
A useful performance report
Document the task set, concurrency, input sizes, output sizes, component timings, retries, failures, quality criteria, and configuration versions. Compare before and after using the same conditions and explain any unavoidable changes.
The practical goal is a timely correct outcome. Pair this article with WorldLensia's benchmark-versus-task-success guide: latency is one component of success, while accuracy, evidence, and completion remain essential. Optimize the largest measured bottleneck, then confirm that users actually finish sooner.
Watch the slowest successful case
Alongside summary statistics, inspect representative slow cases. A long document, a large table, or several dependent tools can reveal a bottleneck hidden by the median. Record whether the same class repeatedly causes delay. A targeted improvement may then help the affected users more than a small reduction in the overall average. Keep failed cases in a separate visible count and explain the timeout rule. A report that drops them from every chart can make a system appear faster precisely when it stops completing the difficult work.
Sources and methodology
OpenAI's latency guidance was checked October 18, 2026. All timings and serial-versus-parallel examples here are explicitly hypothetical arithmetic demonstrations; no provider speed test was conducted.
- OpenAI: Latency optimization — checked October 18, 2026.
Continue with Benchmark versus task success and Document-assistant security checks for related context.
To compare memory constraints with the human review stage, see Quantization: Smaller Model Weights Do Not Tell the Whole Memory Story and Human Review for AI: Design a Decision Process, Not a Rubber Stamp.