

A climate anomaly is a departure from a specified reference. Without that reference, the number is incomplete. Two maps can display different anomaly values for the same observation because they compare it with different baselines, variables or time windows.
That does not mean climate data is arbitrary. It means the transformation must be documented. Before treating two values as conflicting evidence, identify the observed quantity, the reference period, the units, the location and the interval being summarized.

An anomaly is a comparison, not the raw observation
The NOAA Climate Prediction Center's glossary describes an anomaly as a deviation from a long-term reference for a specified quantity, place and period. The observed temperature or rainfall and the departure from a baseline are therefore different fields.
For a simple absolute anomaly, subtract the reference value from the observation. A positive result means the observation exceeds that reference; a negative result means it falls below it. The interpretation still depends on what was measured.
Do not describe an anomaly as an actual temperature or rainfall total. “Two degrees above the reference” and “two degrees” are not the same statement. The first requires a reference value; the second purports to state a level.
A fictional rainfall observation
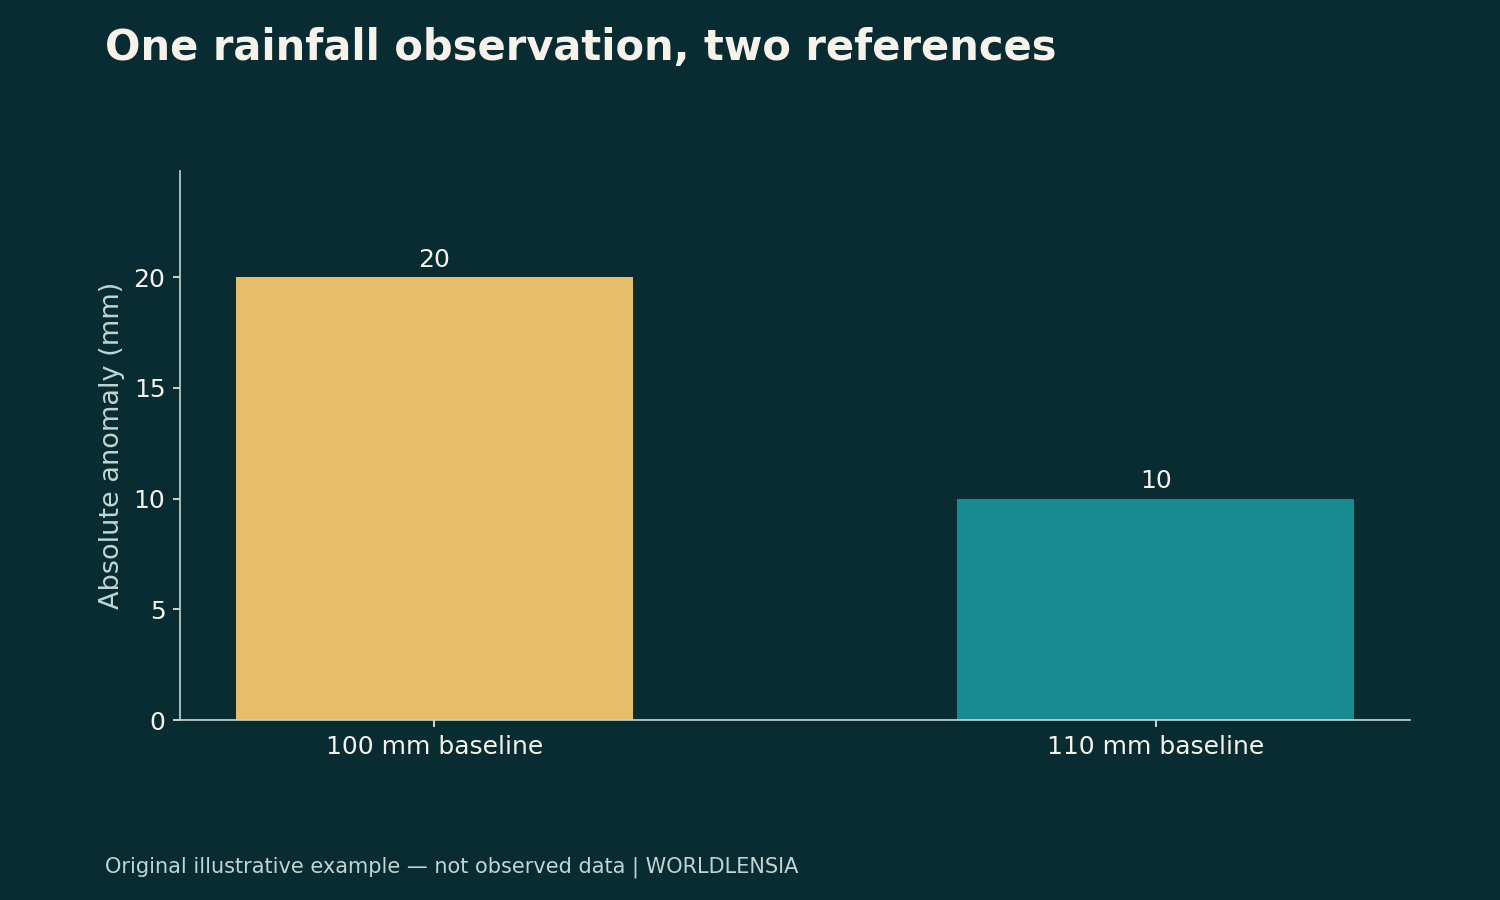
Suppose a place receives 120 mm of rainfall in a fictional month. Compare that observation with a reference mean of 100 mm for the matching month. The absolute anomaly is 120−100=+20 mm.
Now use another stated reference mean of 110 mm. The same observation has an anomaly of 120−110=+10 mm. Nothing about the observed 120 mm changed; the comparison changed.
| Synthetic observation | Reference mean | Absolute anomaly |
|---|---|---|
| 120 mm | 100 mm | +20 mm |
| 120 mm | 110 mm | +10 mm |
These are invented numbers. They are not a current weather report or an estimate for a real city. Their purpose is to show why the reference belongs beside the anomaly.
Percentage anomalies introduce a denominator
For a percentage departure, divide the difference by the reference and multiply by 100. Against 100 mm, the fictional 20 mm departure is +20%. Against 110 mm, the 10 mm departure is approximately +9.09%.
The same raw rainfall therefore produces two different percentage anomalies under two explicitly different references. The difference is mathematically expected, not evidence that the observation was changed.
Check whether a source reports an absolute departure, a percentage departure, a standardized anomaly or a percentile. Those are distinct transformations. A percentage anomaly is not a percentile rank, and a standardized value is not a rainfall total.
Match the season or month
A reference should correspond to the interval being compared. Comparing one month's rainfall with an annual mean can produce a number that answers the wrong question. Seasonal patterns make the interval especially important.
For a real dataset, read how the publisher defines the reference for monthly, seasonal or annual products. Do not infer the method from a familiar map title. A seasonal summary may also require a particular weighting or aggregation procedure.
Store the observation interval and baseline interval separately. “October data” is not a complete description if the chart compares different years, different reference windows or different definitions of the October summary.
A baseline change is not itself a physical change
When a reference changes, the displayed departures can shift even if the underlying observations remain the same. To compare two products, determine whether they share a baseline or whether a documented conversion is needed.
Do not conclude that a smaller anomaly proves the place physically cooled or became drier. First separate the observation from the reference. A physical trend claim requires compatible observations over time, not a comparison of differently based labels.
The reverse warning matters too. A reference-period change does not explain away every observed trend. It is a transformation issue to check, not a universal reason to dismiss changes in the underlying series.
Temperature differences and temperature levels need care
Temperature anomalies are differences. Unit conversions for a difference do not use the same offset as conversions for an absolute temperature. Keep the quantity type visible when converting or labeling a chart.
For any actual calculation, use a documented conversion and the source's units. Do not attach a degree symbol to a standardized index that is not measured in degrees. Similar color palettes can conceal very different numerical quantities.
WorldLensia's surface-versus-air temperature guide addresses another boundary: a surface measurement and an air measurement are not interchangeable. Matching the baseline does not repair a mismatch in the variable itself.
Geography is part of the observation
A station, grid cell, city area and national average can summarize different spatial populations. An anomaly at one location should not automatically be described as the condition across a larger region.
Read how a regional average is constructed and whether the spatial coverage changes. Missing observations, weighting and interpolation can affect the product. Those details require the dataset's method documentation, not assumptions based on the map's appearance.
If the article concerns a city, verify that the measurement actually describes the city under a defensible boundary. A nearby station can be useful evidence, but its relationship to the stated location should be explained.
A monthly anomaly is not a long-term trend by itself
One month above a reference describes that month's comparison. It does not by itself estimate a multi-decade trend or identify the cause of an event. A trend analysis needs a time series, a defined method and an appropriate uncertainty assessment.
Likewise, one month below a reference does not by itself invalidate a longer-term trend. The relevant scales differ. Keep short-term variability and long-term change in separate statements unless the analysis explicitly connects them.
This article makes no claim about current climate conditions or the attribution of a specific event. Its purpose is to make the measurement language precise before such claims are evaluated.
Why percent departures can be unstable near small baselines
In a fictional very dry setting, a change from a 1 mm reference to a 2 mm observation is a +100% departure, even though the absolute difference is only 1 mm. That does not make the percentage wrong. It means the denominator is small.
Report the absolute values when they help readers understand the scale. A large percentage can describe a small amount, while a modest percentage in a wetter setting can correspond to a larger absolute departure.
Do not rank impacts from percentage anomalies alone. Effects on water supply, agriculture or flooding depend on additional conditions and evidence. A rainfall transformation does not by itself measure damage or benefit.
Keep a map legend complete
A useful anomaly map identifies the variable, unit, observation period, reference period and source. It explains whether colors represent absolute departures, percentage departures, standardized values or percentiles.
Avoid using a generic “hotter” or “wetter” label when the chart measures something more specific. Include missing-data treatment and the geographic resolution when they affect interpretation.
Choose color scales consistently when comparing panels. If one map spans a narrow range and another a broad range, the same color can represent different magnitudes. State that difference or use a compatible scale where the comparison requires it.
Do not average incompatible products
Two anomaly series with different baselines may need reconciliation before they can be combined. Different spatial coverage or variables can create additional incompatibilities. Averaging them without a method does not automatically improve the estimate.
Start by identifying the target quantity. Then choose a source or documented synthesis that estimates it. If a custom transformation is necessary, retain the inputs and explain the conversion rather than presenting the result as an unchanged official series.
When compatibility cannot be established, show the products separately and state the limitation. A transparent unresolved comparison is better than a single precise-looking number with no clear meaning.
A source ledger for anomaly reporting
Record the dataset name and version, retrieval date, observation interval, baseline, variable definition, unit, geography and transformation. Add the exact table, file or map used. Keep the raw observation where available alongside the derived anomaly.
If a publisher updates a dataset, preserve the earlier version used in the article and explain any material change. A new version may revise historical observations or methods, which is a different issue from changing only the reference period.
For a calculation, save enough precision to reproduce the displayed result. Round for readability only after the operation is complete, and note the convention if small differences could be misread as substantive.
Connect resource interpretations cautiously
Rainfall is not the same as water available for use. Storage, runoff, withdrawals and other processes matter. The water withdrawal-versus-consumption guide explains why related resource quantities need their own definitions.
Do not infer a city's water security from one rainfall anomaly alone. That broader question needs a relevant hydrological and demand account. The anomaly can contribute context without standing in for the complete system.
Similarly, a temperature departure does not automatically quantify energy demand or health effects. Those are empirical relationships requiring their own methods and populations.
A precise way to compare two headlines
If two reports disagree, first write each claim in full: the raw or derived quantity, place, interval, baseline and unit. Determine whether they actually assert different values for the same thing. Many apparent contradictions disappear when the definitions are restored.
If the claims remain incompatible after that check, inspect source versions, coverage and methods. Do not force agreement by silently switching baselines or deleting qualifications. Explain which evidence supports each statement and what remains unresolved.
For the fictional rainfall example, both +20 mm and +10 mm are correct under their respective references. The accurate summary includes the unchanged 120 mm observation and the two reference values.
What readers should take away
An anomaly is a relationship between an observation and a reference. The baseline is therefore part of the number, not optional background. Matching it is necessary for a fair comparison, alongside matching the variable, place, interval and units.
Once those fields are visible, the statistic becomes easier to interpret and harder to misuse. Stronger claims about trends, causes or consequences can then be evaluated on their own evidence rather than being smuggled into a color or a percentage.
Reference periods should be read from the product, not guessed
Different climate products can use different reference periods for legitimate methodological reasons. Do not assume a baseline because another product from the same organization uses it. Read the metadata for the exact variable and version being shown.
A useful citation includes the product name and reference period directly in the figure caption. The full source ledger can hold additional detail, but the reader should not need to search another file to understand the chart's central comparison.
If the baseline is not stated in the available material, do not calculate a conversion from memory. Obtain the documentation or leave the comparison qualified. An unexplained anomaly is incomplete evidence for a numerical comparison.
Percentiles and anomalies can tell different stories
A percentile locates an observation within a stated reference distribution. An absolute anomaly measures a difference from a reference value. A large departure in physical units need not occupy the same percentile in two places with different variability.
For a real percentile comparison, identify the distribution, reference period and method. Do not convert an anomaly into a percentile by intuition. A histogram, fitted distribution or empirical ranking requires data and a documented procedure.
This is another reason not to compare colors across products without reading the legend. One map can depict departures in millimeters while another depicts relative rarity. The visual intensity may resemble each other while the statistical meaning differs.
Missing observations can change a summary
If a monthly series lacks some observations, inspect how the publisher treats them before calculating a monthly or annual anomaly. A mean over the available subset can differ from a complete-period mean, especially if the missingness follows a pattern.
Do not fill gaps with zero rainfall or an assumed temperature merely to complete a line. Use the source's approved method when appropriate and label any analyst-created imputation. Keep observed values distinct from modeled replacements.
When a map excludes areas with insufficient data, preserve that exclusion in the visual. A blank region should not look like a region with zero anomaly. Availability and magnitude are separate dimensions.
A baseline conversion needs compatible ingredients
For a simple absolute departure, the same observation can be expressed relative to another compatible reference by changing the reference term. But the conversion requires the relevant baseline values for the same variable, place and interval.
Do not apply one location's baseline difference to every grid cell without evidence. Do not assume a standardized index can be converted using the same subtraction as a physical-unit anomaly. The transformation depends on the product.
If a conversion is performed, show the formula, input references and result. Readers should be able to tell that the converted number is an analyst calculation rather than a value copied unchanged from the original source.
Keep an explanatory example separate from an observed event
The 120 mm scenario is intentionally simple. It demonstrates baseline arithmetic and says nothing about a real storm, drought or seasonal outcome. Adding a recognizable city name would not turn it into evidence about that city.
For a current-event article, replace the fictional account only after obtaining and checking the actual observations, metadata and relevant context. Do not mix one real figure with invented surrounding values in a chart that appears wholly empirical.
A baseline note should travel with a copied chart
When a chart is reused in a presentation or social summary, preserve the reference period and variable label. Cropping away the legend can remove information essential to the claim even if the plotted pixels are unchanged.
If space is limited, simplify the chart rather than deleting its meaning. Keep the observation period, unit and baseline in a concise subtitle, and link the fuller method. A visually clean graphic is not accurate if readers cannot identify what its colors compare.
This preserves the comparison when the graphic is separated from the full article.
Sources and methodology
The anomaly concept was checked against the NOAA Climate Prediction Center glossary on October 19, 2026. A publication/update date was not established in the retrieved page. All rainfall values, baselines, transformations and map examples are original hypothetical teaching material. No current climate observation, event attribution or local impact estimate is asserted.
To connect the reference baseline with heat and water comparisons, see Urban Heat Maps: Surface Temperature Is Not Air Temperature and Water Withdrawal vs Consumption: Read City Water Claims Carefully.