
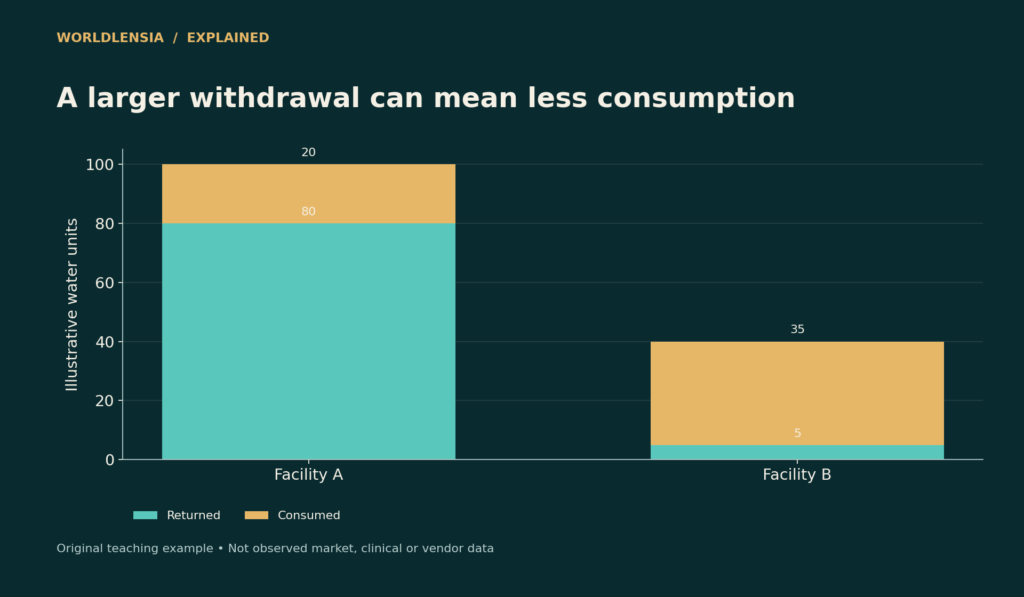
Water removed from a river or aquifer is not necessarily water permanently consumed by the activity using it. Some can return to the local system; some can evaporate, become part of a product, or otherwise be unavailable for another local use. Withdrawal and consumptive use therefore describe different quantities.
USGS water-use materials distinguish withdrawals, deliveries, consumptive use, wastewater releases, and return flows. A headline that collapses them into one undefined “water use” figure can lead readers to compare unlike activities.
Water Withdrawal: A simple water account
Suppose a fictional facility withdraws 100 units of water, returns 80 within the defined local system, and consumes 20 under the simplified accounting boundary. Another withdraws 40 and returns 5, leaving 35 consumed. The first has the larger withdrawal; the second has the larger consumption.
| Facility | Withdrawal | Return flow | Illustrative consumption |
|---|---|---|---|
| A | 100 | 80 | 20 |
| B | 40 | 5 | 35 |
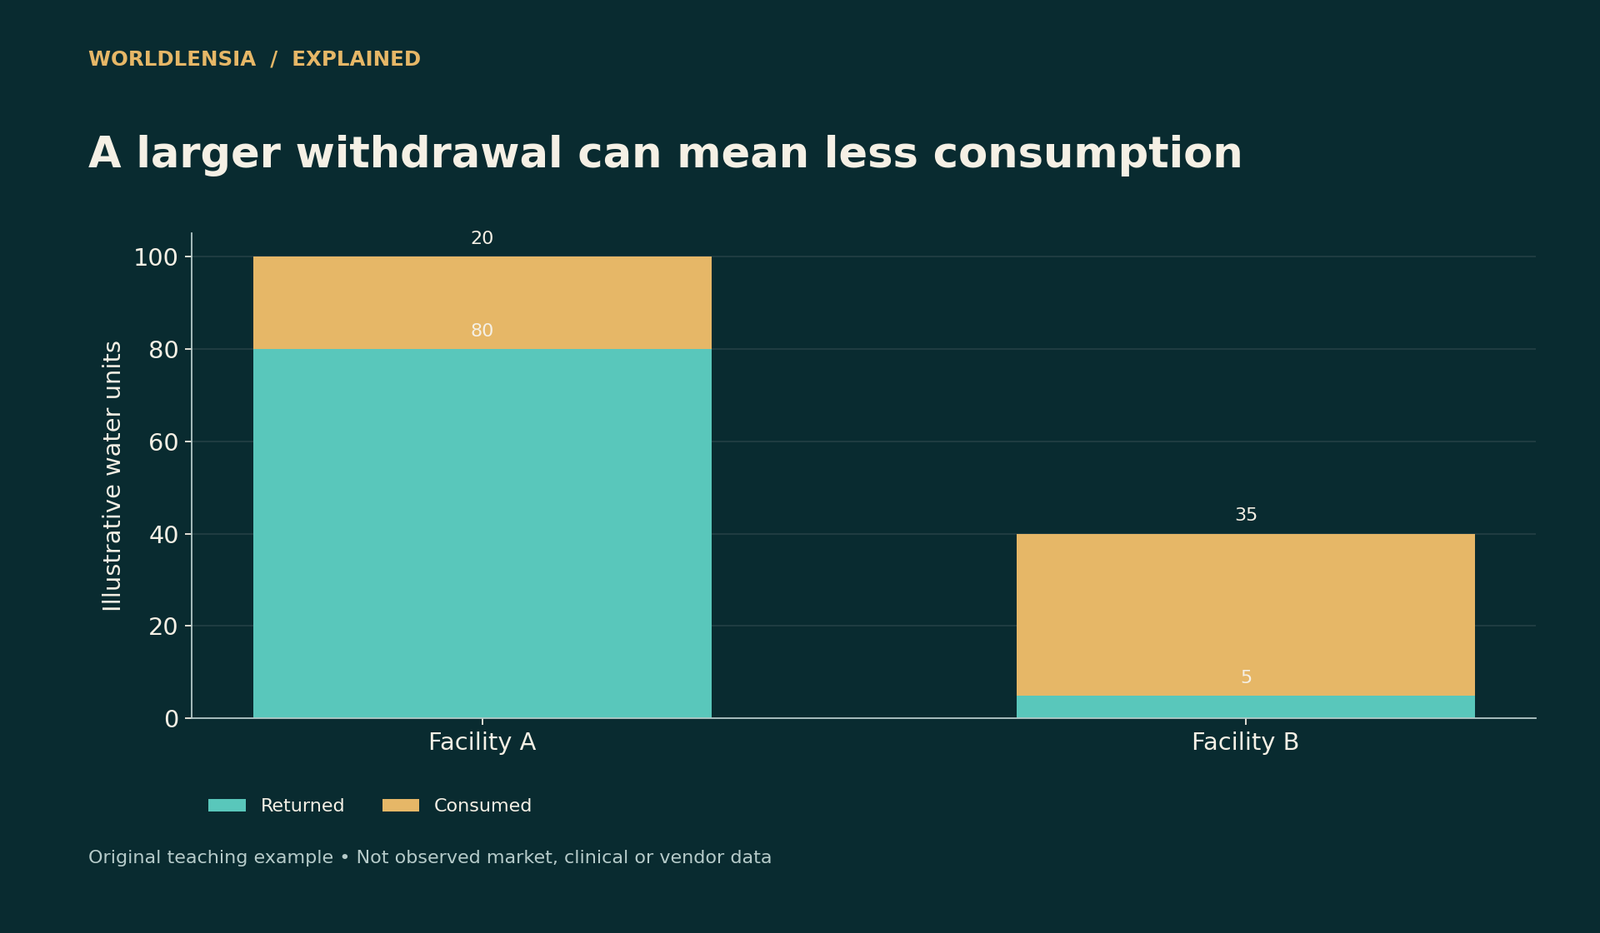
Figure data and assumptions
Original hypothetical teaching data; see the caption and article for assumptions.
| Category | Returned | Consumed |
|---|---|---|
| Facility A | 80.0 | 20.0 |
| Facility B | 5.0 | 35.0 |
The figure shows those flows without claiming that all real water accounts can be reduced to this subtraction. Storage changes, transfers, treatment, timing, and measurement boundaries may require a more detailed balance.
Return location matters
Water returned far downstream or to another basin may not be available to the same users who depend on the withdrawal point. An annual total can also hide a seasonal mismatch between withdrawals and returns. Check where and when the water re-enters the system.
Water quality matters too. A returned volume is not necessarily equivalent in usefulness to the volume withdrawn. Temperature and other characteristics can affect ecosystems and treatment needs. Volume alone does not establish environmental impact.
Do not confuse delivery with source withdrawal
A household's metered delivery, a utility's withdrawal, and the total withdrawal serving a region can differ because their boundaries differ. Distribution losses, treatment operations, other customers, and transfers can be relevant. Dividing a utility total by residents without checking service coverage can create a misleading per-person number.
Likewise, a city government's boundary may not match a utility's service territory. A utility can supply nearby communities or receive water from another provider. Use the actual covered population and clearly describe the denominator.
Annual averages can hide stress
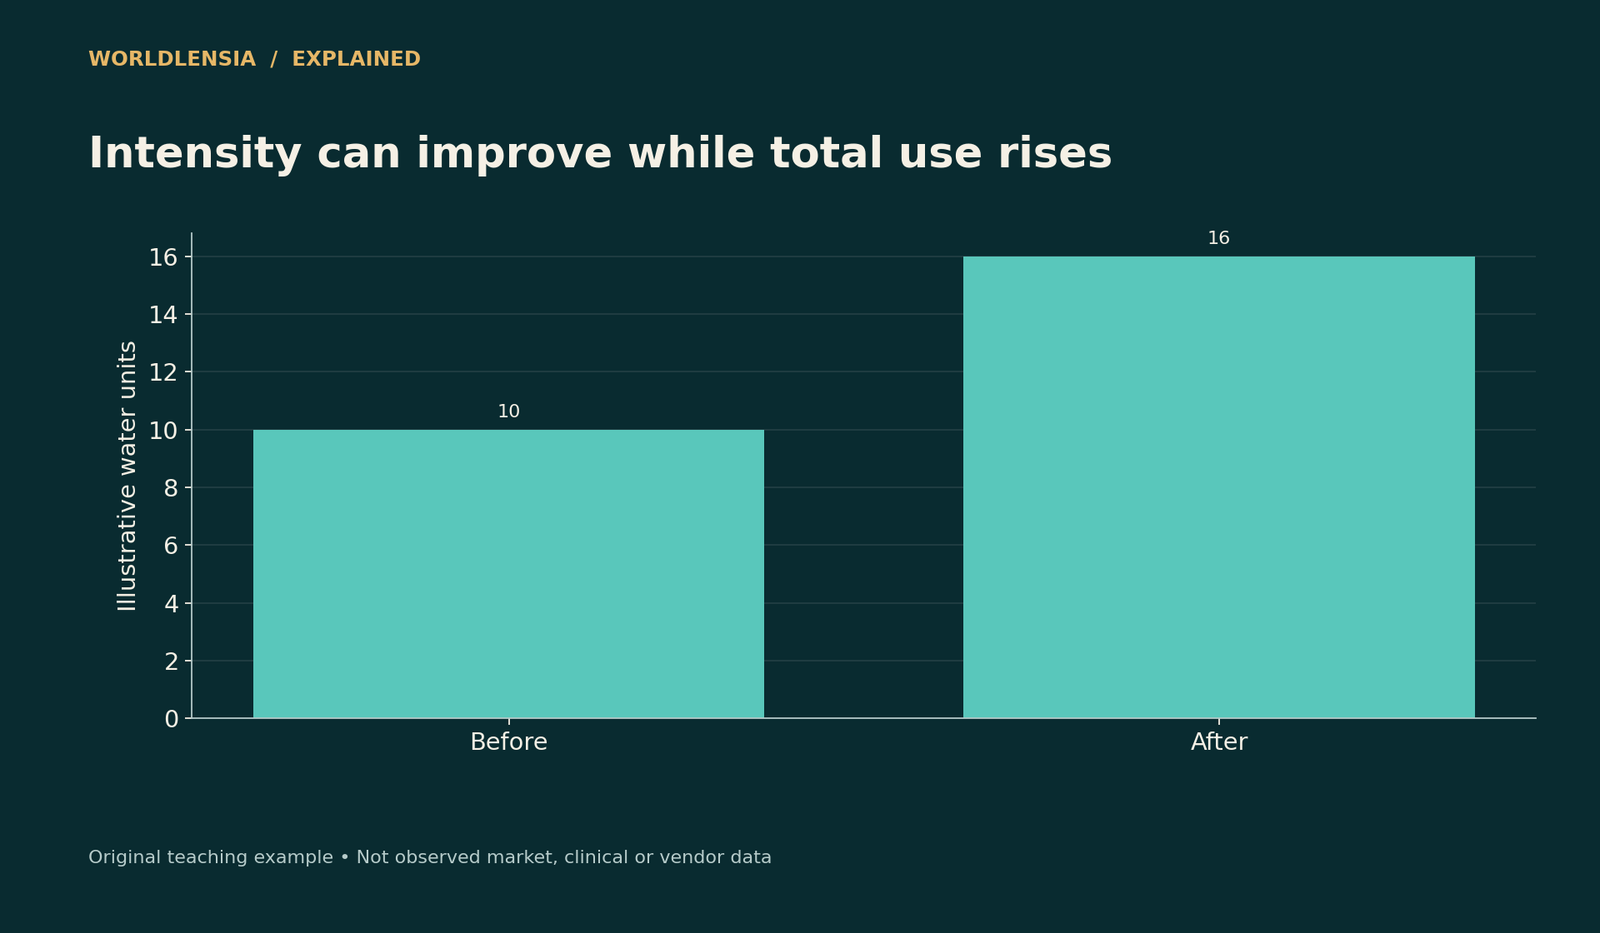
Figure data and assumptions
Original hypothetical teaching data; see the caption and article for assumptions.
| Category | Total consumption |
|---|---|
| Before | 10.0 |
| After | 16.0 |
An activity drawing most of its water during a dry season poses a different timing question from one drawing the same annual total during periods of higher availability. A low annual average does not by itself show that peak withdrawals are harmless.
Use seasonal or monthly data where the claim concerns drought pressure or operational peaks. The appropriate analysis may involve water availability and ecological requirements as well as demand. Do not infer a sustainable limit from consumption percentages alone.
Compare like units and years
Reports can use gallons per day, cubic meters per year, or other units. Convert both volume and time before comparing. An average daily value derived from an annual total is not a measured maximum daily value.
Keep modeled estimates separate from direct meter readings. Both can be useful, but they have different uncertainty and coverage. A new modeled series may also revise earlier understanding rather than document a sudden physical change.
Put efficiency claims in context
Water per unit of output can decline while total use rises if production expands. Conversely, total withdrawals can fall because a facility produced less, not because its process became more efficient. Report the numerator and output denominator together.
For a fictional example, reducing consumption from 10 to 8 units per product is a 20% intensity improvement. Doubling production would nevertheless increase total consumption from 10 to 16 units when comparing one original product with two later products. Efficiency and total pressure are different questions.
A useful reporting checklist
Identify the water quantity, source, geographic boundary, period, unit, covered activity, return destination, and whether the figure is observed or modeled. Then explain what the number does not measure, such as quality, scarcity, or seasonal availability.
This approach allows readers to evaluate conservation claims without assuming that a larger withdrawal always means larger consumption or that a low consumption share makes every withdrawal benign.
Keep efficiency comparisons matched
A process comparison should use the same product, output quality, time period, and water boundary. Water per ton of finished saleable product differs from water per ton entering production. A change in yield can move the ratio without a change in withdrawal technology. Retain both the water amount and the output quantity, and explain whether recycled water within the facility is counted repeatedly or separately. A ratio can be informative while still requiring a detailed account of what moves across the chosen boundary. Do not substitute a generic efficiency label for that account.
Sources and methodology
USGS water-use terminology and water-availability materials were checked October 18, 2026. Facility volumes and production examples are original teaching data, not measurements of a utility, industry, or city.
- USGS: Water glossary — checked October 18, 2026.
- USGS: Water use and availability — checked October 18, 2026.
Continue with Interpret urban environmental maps and Compare rates correctly for related context.
To distinguish water accounting from climate and electricity measures, see Climate Anomalies: The Baseline Is Part of the Number and Electricity Capacity and Generation: Compare Power with Energy.