
A driver stops first and emerges ahead after the rival pits. In another race, staying out longer is the winning move. These are familiar strategy patterns, but the labels alone do not explain why they work. The useful question is where each driver gains or loses time.
At a glance
- An undercut aims to gain time by stopping earlier.
- An overcut aims to gain by staying out longer.
- Tyre performance, warm-up, traffic, and pit losses determine the opportunity.
Follow the timing window
Formula 1’s strategy explainers describe the undercut as gaining track position through an earlier stop and faster laps on fresher tyres. The overcut can work when staying out produces a better timing outcome, such as strong pace before the stop or a rival struggling to warm new tyres.
These are mechanisms, not guarantees. A fresh tyre can be slow to reach its working condition, and a driver can rejoin in traffic. A pit-stop problem or a neutralization can also change the result.
A fictional one-lap undercut
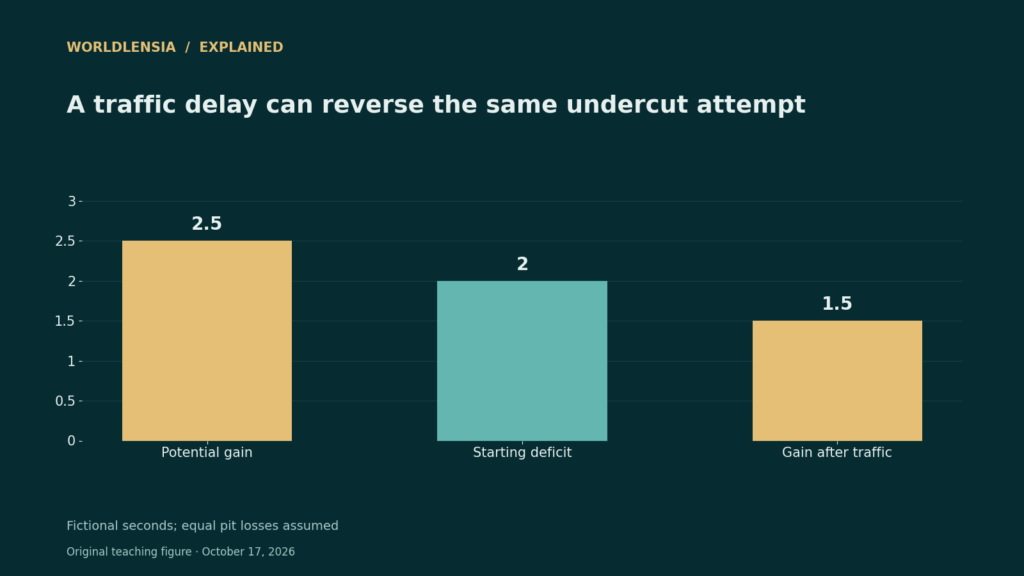
Imagine Driver A trails Driver B by 2.0 seconds. A stops first. During the relevant comparison window, A gains 2.5 seconds through the combined lap sequence, while both drivers have equal pit losses. After both stops, A would be about 0.5 seconds ahead under these simplified assumptions.
Now add 1.0 second of extra traffic delay for A. The net gain becomes 1.5 seconds, leaving A about 0.5 seconds behind. The same “undercut attempt” changes outcome when a practical constraint is included. This example is invented and does not reproduce a specific Grand Prix.
Read live strategy claims carefully
A broadcast gap is not always the full pit window. Check which drivers have stopped, their tyre ages, the pit-entry and exit timing, and the track status. Comparing an out-lap directly with a normal lap can hide the pit sequence.
After a race, use the actual lap and stop data before deciding that a strategy was obviously right or wrong. Assess the information available at the decision time as well as the outcome. A fortunate safety-car timing should not be confused with a guaranteed advantage known in advance.
A practical comparison
| Fictional timing item | Clear-track case | Traffic case |
|---|---|---|
| Starting deficit | 2.0 s | 2.0 s |
| Potential gain | 2.5 s | 2.5 s |
| Extra traffic loss | 0.0 s | 1.0 s |
| Position after equal pit losses | 0.5 s ahead | 0.5 s behind |
Before using the result
- Account for tyre warm-up and traffic.
- Compare the full pit sequence.
- Separate decision quality from fortunate race events.
Continue exploring: more sports statistics explainers.
Sources and methodology
Reviewed October 17, 2026. WorldLensia explanatory analysis. Worked examples and the accompanying teaching figure are illustrative, not measured findings or product tests. Consult the linked source for definitions and revisions.
To connect the strategy example with event timing and result interpretation, see U.S. Grand Prix 2026: Austin Schedule and Time-Zone Guide and Winning Percentage: Compare the Record, the Sample and the Rules.