
Football possession describes a team’s share of the ball under a provider’s measurement method. It does not, by itself, establish how dangerous that possession was or prove that having more of it caused a result.
A match has a sequence. Teams react to the score, opponents, substitutions and remaining time. A final possession percentage combines those changing conditions into one summary, which is useful but incomplete.
Define what the football possession percentage describes
FIFA’s analysis examines the relationship between possession and winning in specified tournament contexts rather than treating a single share as a universal explanation. [1] Its football-language materials distinguish activities performed while in possession, including progressing play. [2]
Those distinctions help separate quantity from purpose. Passing across a defensive line, breaking through pressure and entering a dangerous area can all occur while a team has the ball, but they do not necessarily create the same threat.
Also check the provider’s definition. Different data systems can use different possession conventions. Do not average figures from incompatible methods and present the result as one precise measurement.
Read a fictional match in sequence
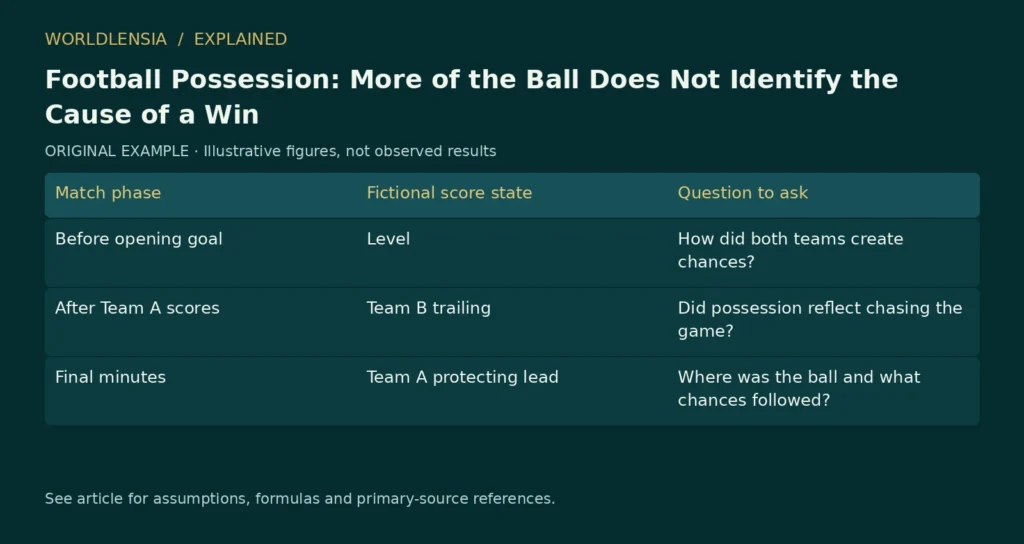
Imagine Team A scores early. For the next hour, Team B keeps the ball more often while seeking an equalizer. Team A defends deeper and attempts counterattacks. At full time, Team B has 65% possession and loses 1–0.
This invented result does not prove that possession is harmful. Nor does it prove that Team B deserved to win. It shows that game state can influence behavior: trailing and leading teams may pursue different actions.
| Match phase | Fictional score state | Question to ask |
|---|---|---|
| Before opening goal | Level | How did both teams create chances? |
| After Team A scores | Team B trailing | Did possession reflect chasing the game? |
| Final minutes | Team A protecting lead | Where was the ball and what chances followed? |
A final percentage loses that sequence. Reviewing phases can reveal whether the aggregate mostly reflects one team’s response to being behind.
Connect possession with progression and chances
Useful follow-up questions include where the ball was held, whether passes advanced play, how often possession reached threatening areas and what chances resulted. Choose measures with documented definitions.
A fictional team could complete many safe passes far from goal while producing few opportunities. Another could have less possession but create several dangerous transitions. Those patterns require event or video evidence; they cannot be reconstructed from possession alone.
Our explanation of expected goals and the scoreline discusses why chance quality and actual goals are separate pieces of information. Expected-goal estimates also have modeling assumptions and should not be presented as a perfect account of what “should” have happened.
A relationship across matches is not a complete causal claim
Stronger teams may both retain possession and win more often. Opponent quality, tactics and game state can influence both variables. Observing that high-possession teams win more often in a sample does not identify how much a possession increase would cause a particular team to improve.
A comparison should state the competition, sample size, period and handling of draws. If the analysis conditions on score state or team strength, explain the method and its remaining limits.
Do not transfer a relationship from one tournament directly to every league, age group or tactical setting. The relevant evidence has a population and context.
Make the match report specific
A stronger sentence says, “Team B had more possession after falling behind, but struggled to convert it into clear chances,” if the event evidence supports that account. A weaker sentence says, “Team B lost despite dominating,” when domination has been inferred only from possession.
Describe observed actions before assigning intent. If a tactical explanation is an interpretation, label it as such and ground it in the match sequence.
Possession becomes informative when it is connected to where, when and how a team used the ball. That approach preserves the statistic’s value without asking one percentage to explain a result that emerged from an entire match.
Keep the score state beside the statistic
For an original match analysis, create separate rows for level, leading and trailing phases where the data support them. Record the minutes covered and avoid comparing a long phase with a brief passage as if their evidence were equal. This does not prove a tactical cause, but it makes the sequence visible and gives readers a stronger basis for judging the interpretation.
Sources and method
- FIFA relationship between possession and winning. November 9, 2023. Checked October 20, 2026.
- FIFA football language, in possession. November 4, 2021. Checked October 20, 2026.
Numerical teaching examples are original and illustrative unless explicitly identified otherwise. No hands-on product testing or individual medical assessment is claimed.
To connect possession with chance quality and scoreline interpretation, see Europa League October 15: Four Results, Four Statistical Lessons.