
A team wins 1–0 despite recording fewer expected goals than its opponent. Does that make the result wrong? No. The score records goals that happened, while expected goals summarizes modeled chance quality. They describe different aspects of the match.
At a glance
- Expected goals is a model-based assessment of scoring chances.
- A modeled total is not a promised or deserved score.
- Compare providers and samples consistently.
Start with the shot, not the final table
FIFA includes expected goals among its football intelligence metrics. A typical shot-based xG approach assigns a scoring probability to each attempt using information available to the model. Different providers can include different features and training data, so their outputs need not match.
Check the provider’s definition before comparing values. A pre-shot model and a post-shot measure can answer different questions. Penalties, own goals, blocked attempts, and data corrections also need consistent treatment.
A fictional two-shot example
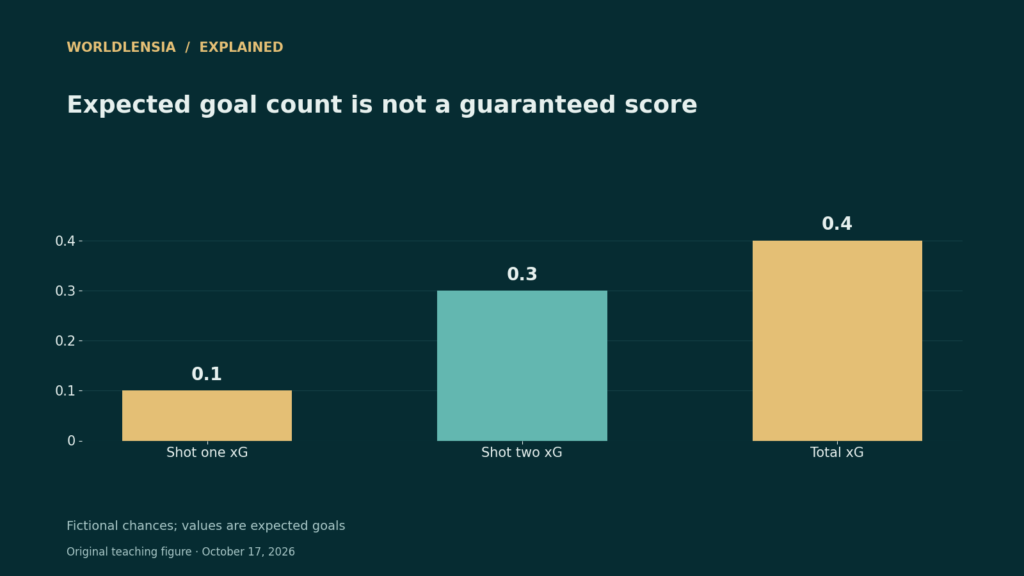
Suppose a team takes two shots with modeled scoring probabilities of 0.10 and 0.30. Its total xG is 0.40. It could still score zero, one, or two goals. The sum describes expected goals across comparable modeled opportunities, not a constraint on the actual result.
Under a simplified independence assumption, the chance of at least one goal is one minus 0.90 multiplied by 0.70, or 37%. That differs from 40% because expected goal count and probability of any goal are different quantities. The independence assumption and invented probabilities make this a teaching example, not an analysis of a real match.
Use more context before judging a team
Ask when chances occurred and what the score was at the time. A team protecting a lead may change its approach. Red cards, opponent strength, and tactical choices can also affect the pattern. The total alone does not reconstruct those events.
For longer-term assessment, use a consistent provider and look across multiple matches alongside goals, shot locations, and game context. Avoid turning one surprising result into proof that a team is unusually clinical or permanently unlucky. The model is one lens on performance, not the entire match.
A practical comparison
| Fictional opportunity | Modeled xG |
|---|---|
| Shot one | 0.10 |
| Shot two | 0.30 |
| Total expected goals | 0.40 |
| At least one goal under independence | 37% |
Before using the result
- Identify the model and provider.
- Do not label xG as a deserved final score.
- Keep modeled expectations separate from observed goals.
Continue exploring: our sports and statistics coverage.
Why 0.40 expected goals is not a 40% win probability
In the fictional two-shot example, 0.40 is the expected number of goals from those attempts. The 37% figure is a probability of at least one goal under the stated independence assumption. Neither figure describes the opponent’s chances, extra time, penalties or the full match, so neither is a match-win probability.
This distinction also appears in basketball pace versus efficiency: choose the statistic that matches the question. Our tennis scoring example shows why a useful performance total can differ from the rules that determine the winner.
Sources and methodology
Reviewed October 17, 2026. WorldLensia explanatory analysis. Worked examples and the accompanying teaching figure are illustrative, not measured findings or product tests. Consult the linked source for definitions and revisions.
To read the match statistic alongside game state and sample size, see Football Possession: More of the Ball Does Not Identify the Cause of a Win and Winning Percentage: Compare the Record, the Sample and the Rules.