
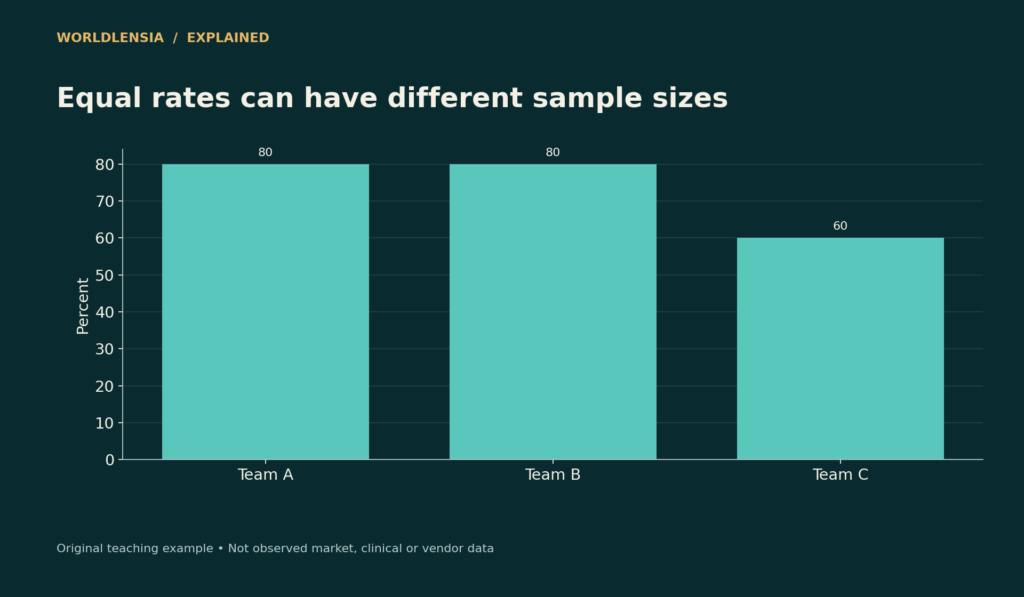
A winning percentage compresses a record into a proportion, making teams with different numbers of completed games easier to compare. It does not erase differences in opponents, schedule, or sample size. A team winning four of five has the same observed proportion as one winning forty of fifty, but the evidence behind the two records is different.
For a competition without draws in the counted record, divide wins by wins plus losses. Always check the sport's official treatment of ties and other outcomes before using the calculation. This article uses fictional records and does not report current standings or predict a game.
Calculate the proportion
Team A has 8 wins and 2 losses. Its winning proportion is 8 ÷ 10 = 0.800, or 80%. Team B has 40 wins and 10 losses, also 80%. Team C has 18 wins and 12 losses, or 60%.
| Fictional team | Wins | Losses | Counted games | Winning percentage |
|---|---|---|---|---|
| A | 8 | 2 | 10 | 80% |
| B | 40 | 10 | 50 | 80% |
| C | 18 | 12 | 30 | 60% |
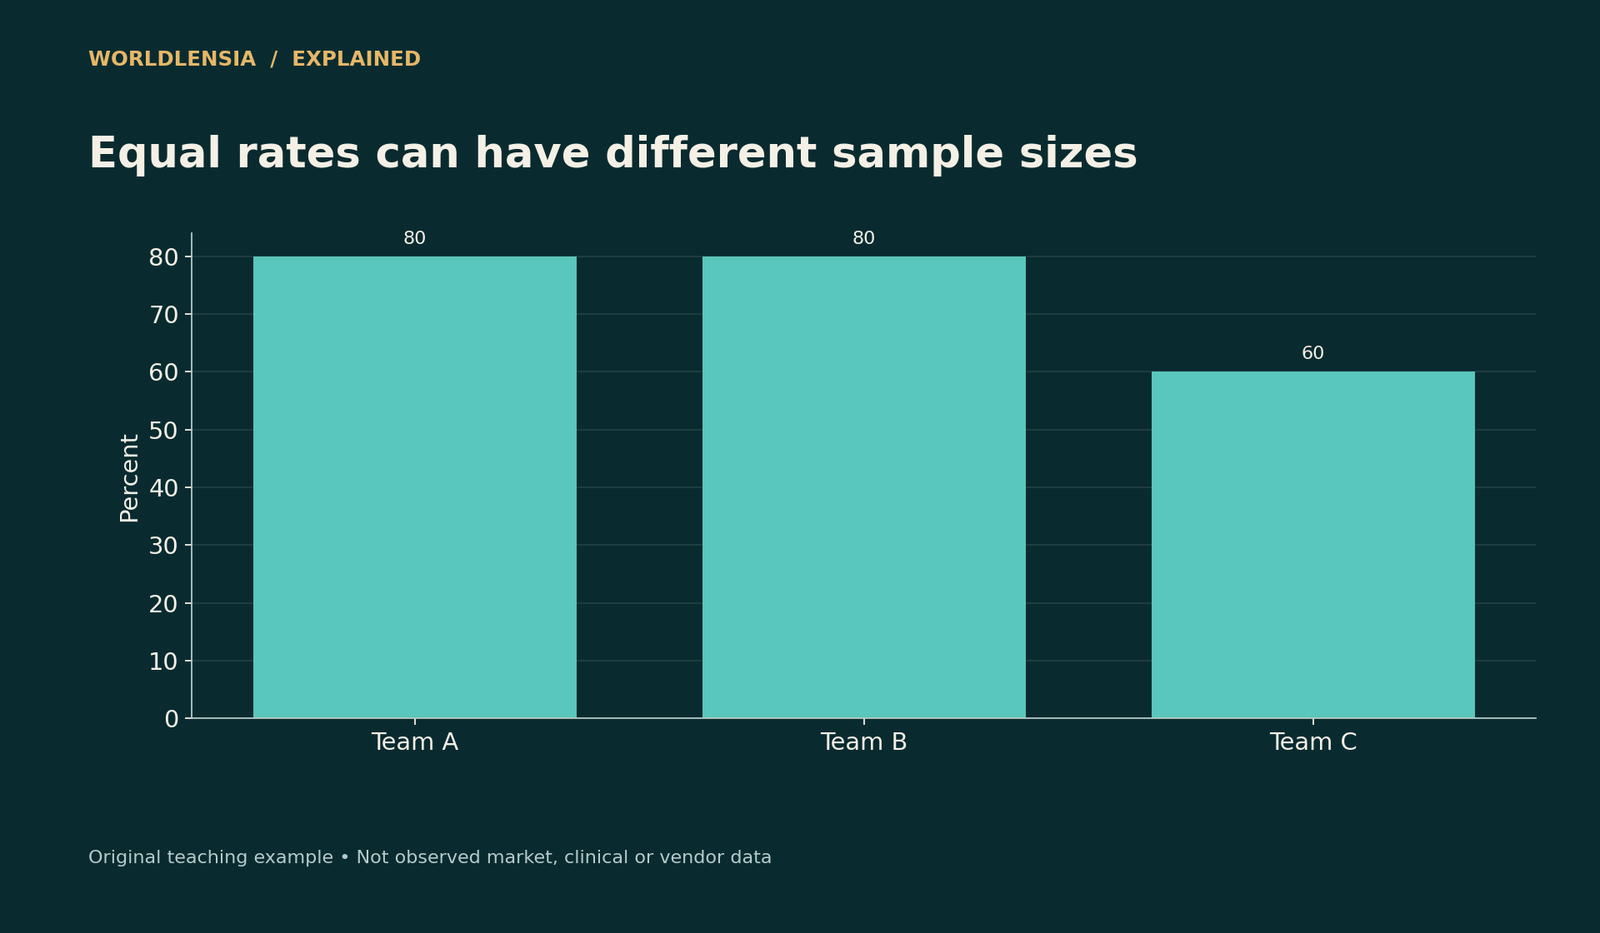
Figure data and assumptions
Original hypothetical teaching data; see the caption and article for assumptions.
| Category | Winning percentage |
|---|---|
| Team A | 80.0 |
| Team B | 80.0 |
| Team C | 60.0 |
The first chart shows rates; the second shows game counts. Putting both views together discourages readers from treating equal percentages as equal amounts of evidence.
One result moves a short record more
If Team A loses its next game, its rate becomes 8 ÷ 11, approximately 72.7%. If Team B loses, it becomes 40 ÷ 51, about 78.4%. The same additional loss creates a much larger movement in the shorter record.
That arithmetic does not prove which team is stronger. It shows why early-season rates can fluctuate sharply. Report the underlying record alongside the percentage rather than implying that a few games establish a stable ability level.
Do not average percentages without weights
Suppose one period contains 8 wins in 10 games and another contains 2 wins in 10. The combined rate is 10 ÷ 20 = 50%, equal to the simple average because the samples are equal.
If the second period instead contains 20 wins in 100 games, the combined rate is 28 ÷ 110, approximately 25.5%. The simple average of 80% and 20% is still 50%, which is wrong for the combined game-weighted record. Add wins and counted games before dividing.
Rules can change the denominator
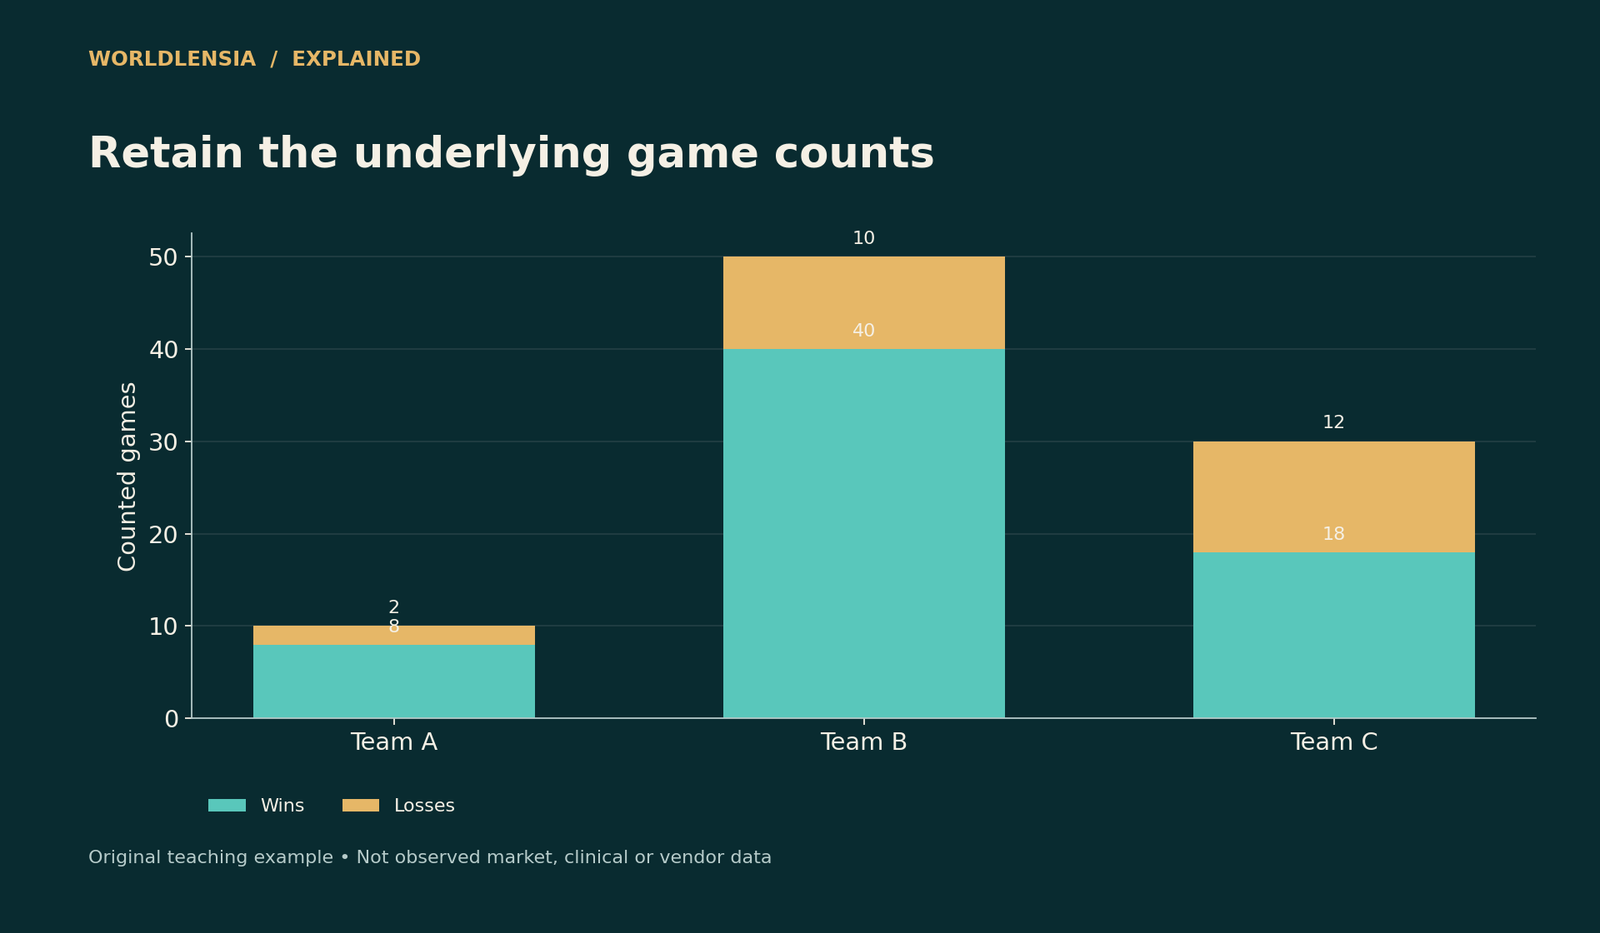
Figure data and assumptions
Original hypothetical teaching data; see the caption and article for assumptions.
| Category | Wins | Losses |
|---|---|---|
| Team A | 8.0 | 2.0 |
| Team B | 40.0 | 10.0 |
| Team C | 18.0 | 12.0 |
Some competitions handle draws, overtime losses, abandoned contests, or points deductions through distinct systems. A points percentage is not necessarily a winning percentage. A record containing several outcomes needs the league's actual convention.
State the rule used and the scope of the record. Do not import a baseball-style calculation into a points-based league without checking. The MLB glossary is cited only for the basic win-loss definition, not as a source for every sport's standings rules.
Opponent strength remains outside the ratio
Two teams with identical records may have faced different schedules. Home and away games, injuries, rest, and opponent quality can affect interpretation. The raw percentage summarizes outcomes; it does not adjust automatically for those factors.
A more elaborate model can attempt adjustments, but its assumptions need explanation and evaluation. Avoid presenting an adjusted rating as a directly observed fact or assuming that it guarantees the result of a future match.
Team outcomes and individual attribution differ
A statistic credited to an individual player may follow attribution rules rather than simply representing the team's performance while that player participated. Read the precise definition before interpreting a player record as a complete assessment of ability.
For team analysis, use additional performance evidence appropriate to the sport. WorldLensia's expected-goals guide illustrates why chance quality and final score can tell different parts of a football story. Neither should be forced to answer every question alone.
A clear standings paragraph
Report wins, losses, counted games, percentage, relevant rule, and the comparison period. If samples are small or schedules differ materially, say so. Distinguish a description of completed results from a prediction of future performance.
This modest amount of context makes the number useful without turning it into a verdict. Fans can see what the record establishes, what it leaves out, and why a single additional result can alter an early-season ranking sharply.
Show the record beside the chart
A rate-only graphic can conceal whether the denominator is five games or fifty. Put the win-loss record in the label or companion table. Use a clear date and competition scope for real standings. If playoffs and regular-season games are combined, say so and explain why. Different phases can involve different opponents and formats. The same arithmetic can still be calculated, but the interpretation should fit the collection of games actually counted. Keeping that context visible makes a short statistical comparison more informative without turning it into an unsupported forecast.
Sources and methodology
MLB's winning-percentage glossary was checked October 18, 2026 for the basic formula. The teams, records, weighting examples, and next-game calculations are original teaching scenarios, not current sports results.
- MLB: Winning-percentage formula — checked October 18, 2026.
Continue with Expected goals versus results and Percent and percentage points for related context.
To see how sport-specific rules change a record comparison, see Batting Average vs On-Base Percentage: Walks Change the Comparison and Do Both Teams Get the Ball in NFL Overtime? 2026 Rules Explained.