
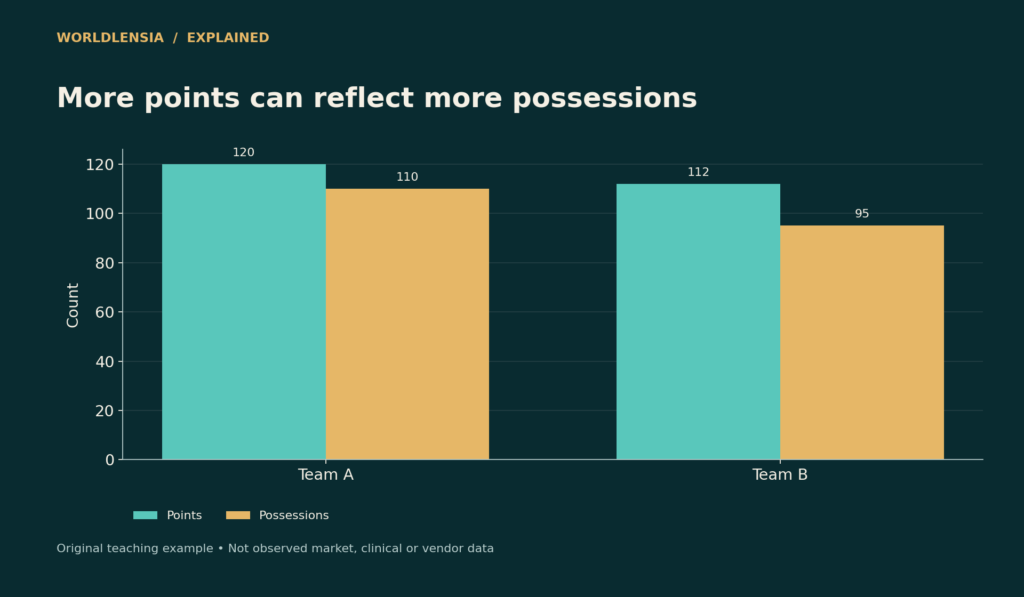
A basketball team can score more points per game because it uses its possessions more effectively, because it plays more possessions, or both. Looking only at the scoreboard average mixes pace with efficiency. A per-possession view helps separate those explanations.
The NBA's educational material distinguishes scoring totals from possession-based ratings. This article uses original fictional team examples to explain the arithmetic. It is not a current league ranking, a scouting model, or a prediction of future results.
Points per Possession: Start with the same denominator
Suppose Team A scores 120 points across 110 possessions and Team B scores 112 across 95. A scores more points, but its rate is about 109.1 points per 100 possessions. B's is about 117.9.
| Fictional team | Points | Possessions | Points per 100 possessions |
|---|---|---|---|
| A | 120 | 110 | 109.1 |
| B | 112 | 95 | 117.9 |
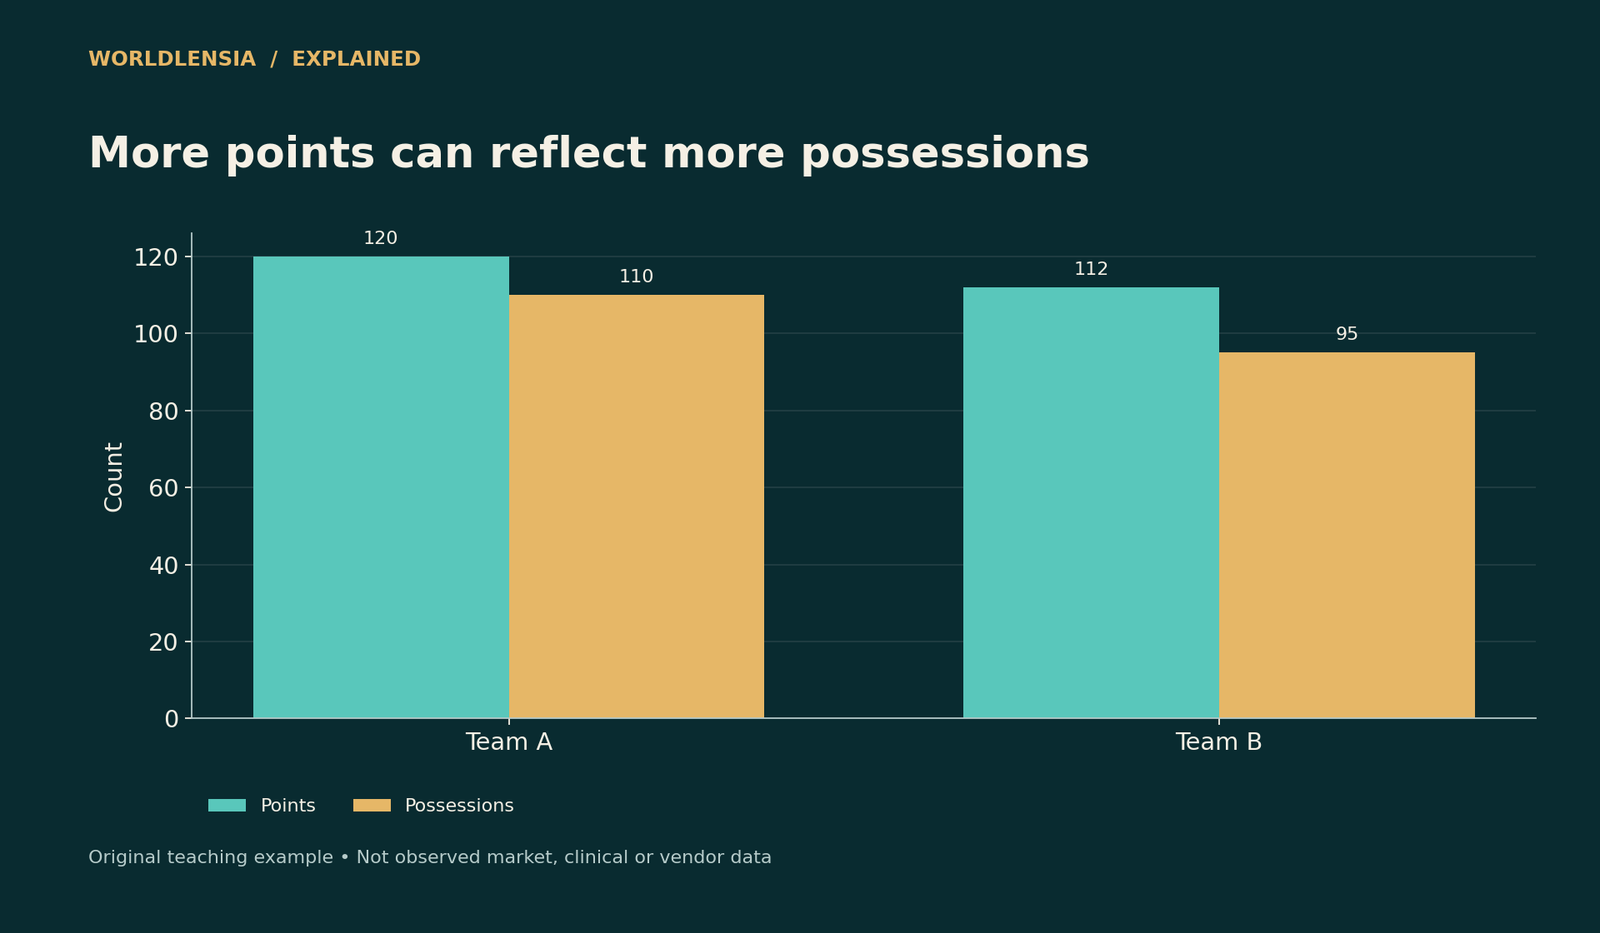
Figure data and assumptions
Original hypothetical teaching data; see the caption and article for assumptions.
| Category | Points | Possessions |
|---|---|---|
| Team A | 120.0 | 110.0 |
| Team B | 112.0 | 95.0 |
The first figure compares scoring totals and the second compares normalized efficiency. Neither is labeled a measure of overall team strength because defense and other evidence remain outside this example.
Why multiply by 100?
Points per possession is points divided by possessions. Multiplying by 100 expresses the same rate on a more familiar scale. It does not create 100 observed possessions or add statistical confidence.
Team A's 1.091 points per possession and 109.1 per 100 convey the same relationship. Keep the unit visible so a reader does not compare one source's per-possession figure directly with another's per-100 figure.
Aggregate before dividing
If a team plays two games with different possession counts, calculate total points divided by total possessions for the combined rate. An unweighted average of the two game rates gives each game equal influence, which is a different measure.
For example, 100 points in 80 possessions and 100 points in 120 possessions produce rates of 125 and 83.3 per 100. Their simple average is about 104.2, but the combined 200 points in 200 possessions gives 100. State which weighting matches the question.
Possessions require a consistent method
Some data sources count possessions from play-by-play; others estimate them from box-score components. Their definitions and adjustments can differ. Read the method before combining values from different providers.
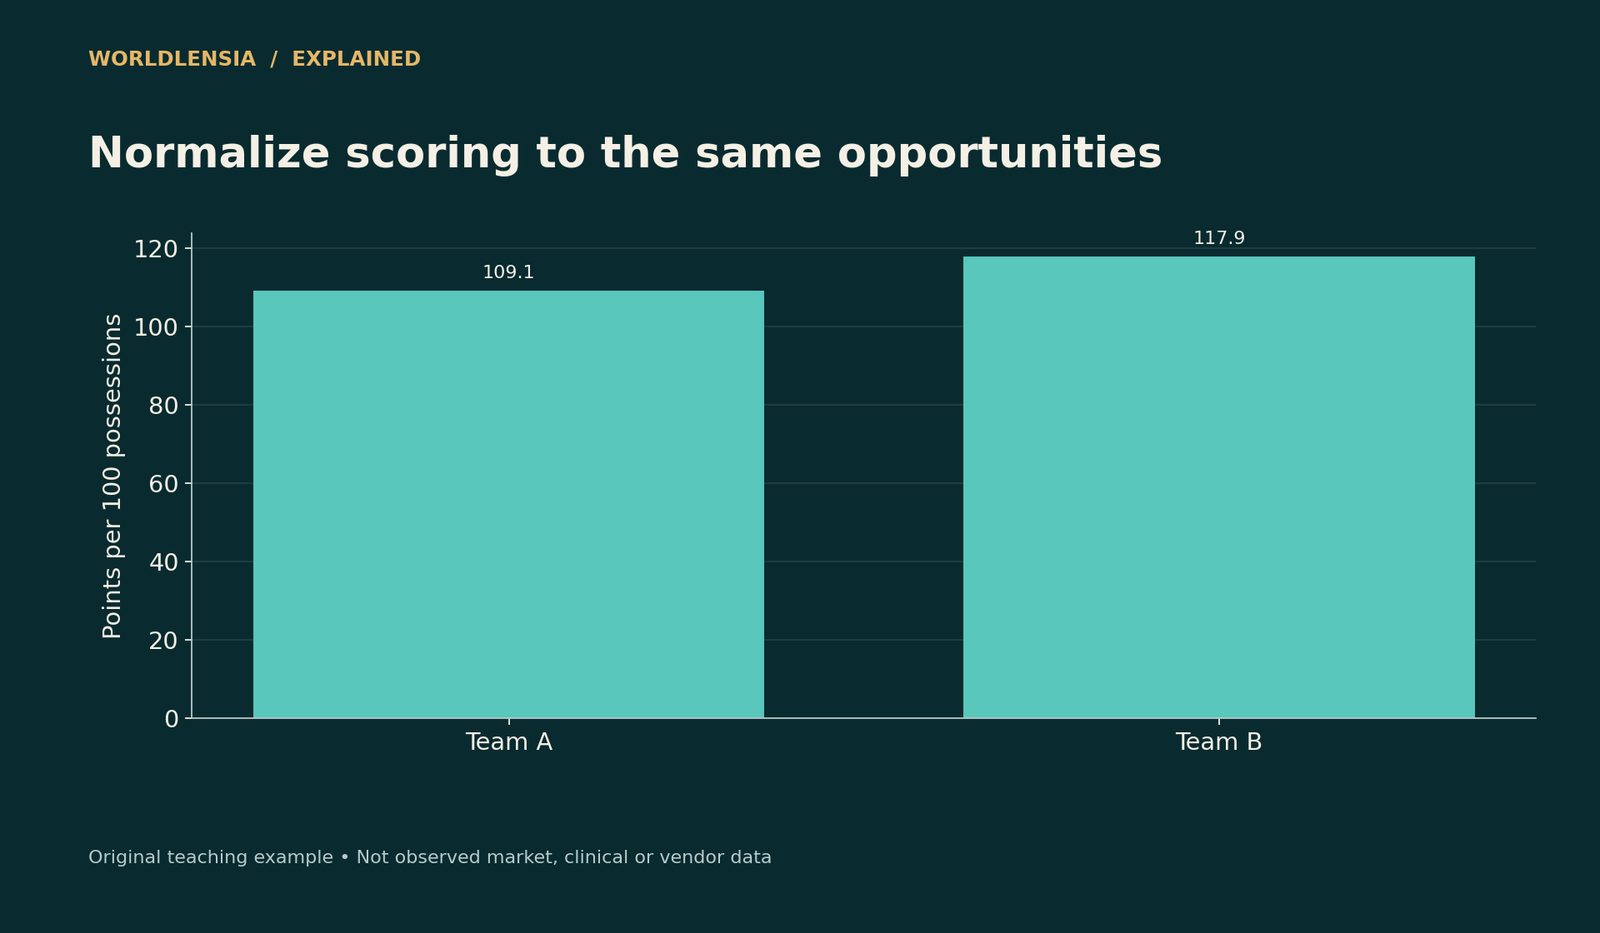
Figure data and assumptions
Original hypothetical teaching data; see the caption and article for assumptions.
| Category | Points per 100 possessions |
|---|---|
| Team A | 109.09090909090908 |
| Team B | 117.89473684210525 |
An offensive rebound also illustrates why a shot attempt and a possession are not identical concepts. Several events can occur within one team's control sequence. Do not substitute field-goal attempts for possessions and keep the original rating label.
Compare offense and defense
A team that scores efficiently but allows opponents to score even more efficiently can still lose. Net rating compares offensive and defensive ratings using a consistent basis. Scoring efficiency alone is not a complete outcome measure.
Likewise, a faster pace can create more opportunities for both teams. A high points-per-game average does not independently establish superior offense, and a low average does not prove poor offense. Inspect possessions and scoring efficiency together.
Context still matters
Opponent quality, lineups, home and away conditions, game state, and sample size can affect interpretation. A brief run against weak opponents should not be treated as a season-long estimate without qualification.
Per-possession normalization removes one scale difference; it does not remove every contextual difference. A model adjusting for opponents asks a further question and should disclose its own assumptions and uncertainty.
Player and team rates need different care
A team's rate while a player is on court is not automatically the points that player personally created. Teammates, opponents, rotations, and the role assigned can influence the result. Avoid attributing a lineup outcome entirely to one individual.
Similarly, on-off comparisons can reflect who replaces the player and when substitutions occur. They can prompt useful investigation without proving a causal individual impact on their own.
Write the comparison clearly
Report scoring totals, possessions, normalized rate, observation period, and data method. Then add defense and context if the claim concerns overall quality. Keep predictions separate from descriptions of completed play.
WorldLensia's winning-percentage guide makes the related point about denominators and sample size. The arithmetic is simple; the valuable analysis comes from matching the measure to the question rather than letting a large scoring total answer everything.
Keep per-game and per-possession labels distinct
If a graphic switches from points per game to points per 100 possessions, change the axis label and explain the normalization. The values are not interchangeable even when they happen to be numerically close. A reader should not need to infer the unit from a title. For real data, preserve the provider and observation window in the caption. The fictional examples here demonstrate how a ranking can reverse after normalization; they do not identify which actual team has the best offense or establish a future scoring expectation.
Sources and methodology
NBA educational material on traditional and advanced statistics was checked October 18, 2026. All team figures and aggregation examples here are original hypothetical calculations, not licensed league data or current results.
- NBA: Traditional and advanced statistics — checked October 18, 2026.
Continue with Chance quality and the scoreline and Compare percentages fairly for related context.
To compare weighted sports rates without dropping their denominators, see Winning Percentage: Compare the Record, the Sample and the Rules and Cricket Net Run Rate: Aggregate Runs and Overs Before Comparing.