
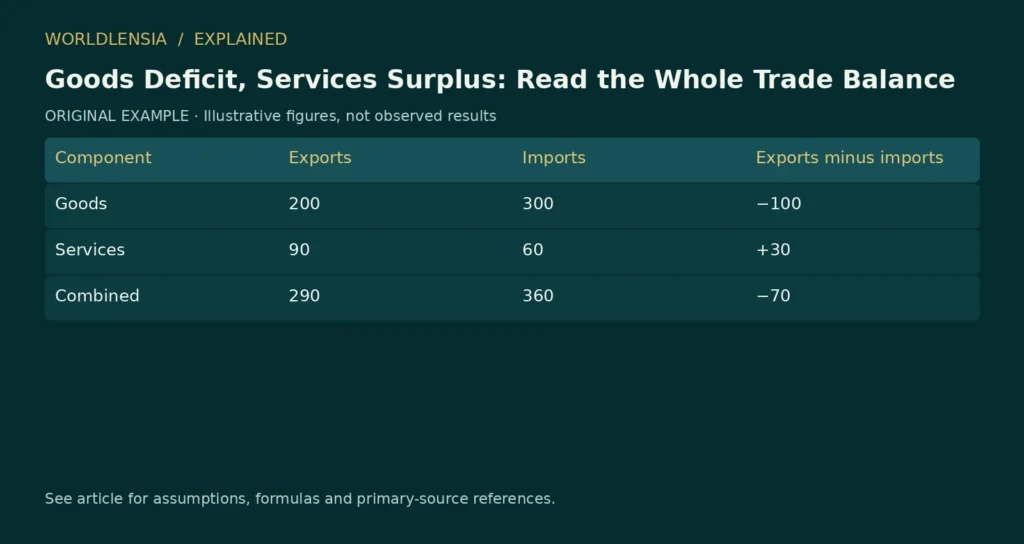
The trade balance is exports minus imports over a stated period. A country can have a deficit in goods and a surplus in services at the same time. The combined goods-and-services balance reflects both components.
This is an accounting relationship, not a complete judgment about economic strength. A single balance does not reveal why trade changed, how different households or industries were affected, or whether a particular policy caused the result.
State the boundary before the number
BEA’s trade overview describes sales by U.S. residents to residents of other countries as exports and purchases as imports. The difference is the trade balance. [1] Its international economic accounts primer places goods and services within the broader external accounts. [2]
The distinction between goods and services matters because a headline about merchandise trade may exclude services. A report discussing a bilateral balance may also use different coverage from a headline describing the total economy.
This article uses fictional figures to show the arithmetic. It does not substitute those figures for a current release or claim to explain the latest movement in any country’s trade.
Use signed balances consistently
Suppose exports and imports in one fictional month are as follows, in billions of currency units.
| Component | Exports | Imports | Exports minus imports |
|---|---|---|---|
| Goods | 200 | 300 | −100 |
| Services | 90 | 60 | +30 |
| Combined | 290 | 360 | −70 |
The goods deficit is 100, the services surplus is 30 and the combined deficit is 70. If a chart uses signed values, the combined balance is −100 + 30 = −70.
If another chart expresses deficits as positive magnitudes, label that convention. A movement from a deficit of 70 to a deficit of 60 is a narrowing deficit, although the displayed positive number falls. A signed balance would move from −70 to −60, which is an increase.
Writers can avoid ambiguity by naming both the direction and the amounts rather than saying only that “the balance increased.”
An improved balance has several possible causes
Suppose the combined balance moves from −70 to −50. That improvement could reflect higher exports, lower imports or changes in both. It could arise from goods, services or offsetting movements across them.
A decline in imports might reflect weaker domestic demand, lower import prices, substitution toward domestic production or other factors. The accounting total does not identify the cause. Read component quantities, prices and relevant contextual evidence before making a causal claim.
Likewise, a larger deficit does not by itself demonstrate that every domestic producer is doing worse. Industries differ in their use of imported inputs, export markets and domestic sales. The aggregate describes the net balance within its scope.
Values and volumes answer different questions
A trade value can rise because the price of a product rose even if its physical quantity did not. If the question concerns volumes, find an appropriate real or quantity measure and read how it is constructed.
For example, a fictional importer buys 100 units at 2 currency units each, then 100 units at 3 each. Import value rises from 200 to 300, or 50%, while quantity is unchanged. That calculation illustrates a price effect; it is not a claim about any actual commodity market.
Exchange rates can also affect the relationship between values reported in different currencies. Do not compare a foreign-currency series with a domestic-currency series without making the conversion method and period explicit.
Keep the release and the observation period separate
A release published in October can describe an earlier month. Record both dates. If the data are revised, preserve which release supplied the previous and current observations.
Use either consistently seasonally adjusted comparisons or a clearly justified unadjusted comparison. Mixing a seasonally adjusted total with unadjusted components can make the arithmetic look inconsistent even when each series is correct within its own framework.
Goods data on a customs basis may also require adjustments to align with balance-of-payments concepts. When a report uses a particular basis, keep that basis visible. Similar labels do not guarantee that two tables share identical definitions.
Do not confuse the trade balance with the current account
Goods and services form an important part of external accounting, but broader balances include other flows. A trade figure should not be relabeled as the current-account balance without checking the additional components.
Our explanation of GDP and GDI provides another example of how related national-accounting measures can answer different measurement questions. The practical habit is the same: identify the concept, scope and reporting period before interpreting the headline.
A useful trade summary shows exports, imports, goods, services and the combined balance together. It then distinguishes the observed arithmetic from any explanation of why the changes occurred. That gives readers an account they can reproduce rather than a single number carrying more meaning than it can support.
Decompose a fictional monthly movement
Return to the invented combined deficit of 70. Suppose next month’s goods exports rise by 10, goods imports rise by 5, services exports rise by 3 and services imports rise by 1. The goods balance improves by 5, the services balance improves by 2 and the combined deficit narrows by 7, from 70 to 63.
That bridge explains the total without claiming a cause. It is stronger than observing a smaller deficit and guessing that imports must have fallen. In this scenario, both goods and services imports increased; exports increased by more.
For an actual release, reproduce the bridge using compatible component values and allow for rounding. If the displayed movements do not sum exactly, inspect the full-precision data and methodological notes. Do not alter a source figure merely to make rounded numbers reconcile.
The same approach helps compare revisions. Preserve the earlier release’s balance and component values, then show how the revised observations change the account. A revision is new information about an earlier period, not necessarily new trade occurring today.
For a chart, keep the zero line visible when showing signed balances. A surplus and deficit should not be stacked as if both were positive contributions to the same total. Label the convention directly so the visual reinforces the arithmetic rather than reversing it.
Sources and method
- BEA international trade overview. Current release October 6, 2026; methodological page modified May 5, 2026. Checked October 20, 2026.
- BEA international economic accounts primer. July 2021. Checked October 20, 2026.
Numerical teaching examples are original and illustrative unless explicitly identified otherwise. No hands-on product testing or individual medical assessment is claimed.
To retain valuation conventions and production boundaries in trade comparisons, see PPP vs Exchange Rates: Compare Countries Without Mixing Questions and Gross Output vs Value Added: Follow a Product Through the Supply Chain.