
Precision and recall help reveal errors that overall accuracy can hide. An AI system can be accurate on almost every item and still fail at the task that matters. Imagine a document service receiving 10,000 files, only 100 of which require urgent specialist review. A system that labels every file routine would be right 9,900 times. Its accuracy would be 99%, but it would identify none of the urgent files. That is a successful score attached to an unsuccessful workflow.
Precision and recall help expose the difference. Precision asks how many flagged items actually belong in the target class. Recall asks how many of the real target items the system found. Accuracy counts correct decisions across the whole collection. None can tell a complete operational story alone.
This guide uses a fictional document-review task, original calculations, and deliberately simple assumptions. The numerical examples are teaching data, not measurements of any commercial model. The evaluation principles apply to classifiers and screening workflows; an open-ended writing assistant also needs checks for factual support, completeness, and usability.
1. Define the decision before judging precision
Write the action that follows the prediction. Does a flag send a document to a reviewer, block an upload, notify a customer, or initiate a consequential decision? Those actions carry different costs. A reviewer queue can tolerate some unnecessary flags. Automatically deleting an item requires a much stronger justification and a recovery mechanism.
Next define the target class in terms a human can label consistently. “Bad document” is too vague. “Contains an invoice number that conflicts with the purchase record” is more testable. Document the exceptions, such as a legitimate credit note that refers to an older purchase. An unclear label makes apparent model errors difficult to separate from disagreement about the task itself.
The label should reflect what was knowable at decision time. If an invoice was later corrected, a historical test should not silently treat the final version as evidence available earlier. This is one reason to retain source versions and timestamps alongside predictions.
2. Read the four cells before calculating precision
For the fictional 10,000-file collection, suppose the service finds 80 of the 100 urgent items and incorrectly flags 120 routine files.
| Actual status | Flagged urgent | Labeled routine | Total |
|---|---|---|---|
| Urgent | 80 true positives | 20 false negatives | 100 |
| Routine | 120 false positives | 9,780 true negatives | 9,900 |
| Total | 200 | 9,800 | 10,000 |
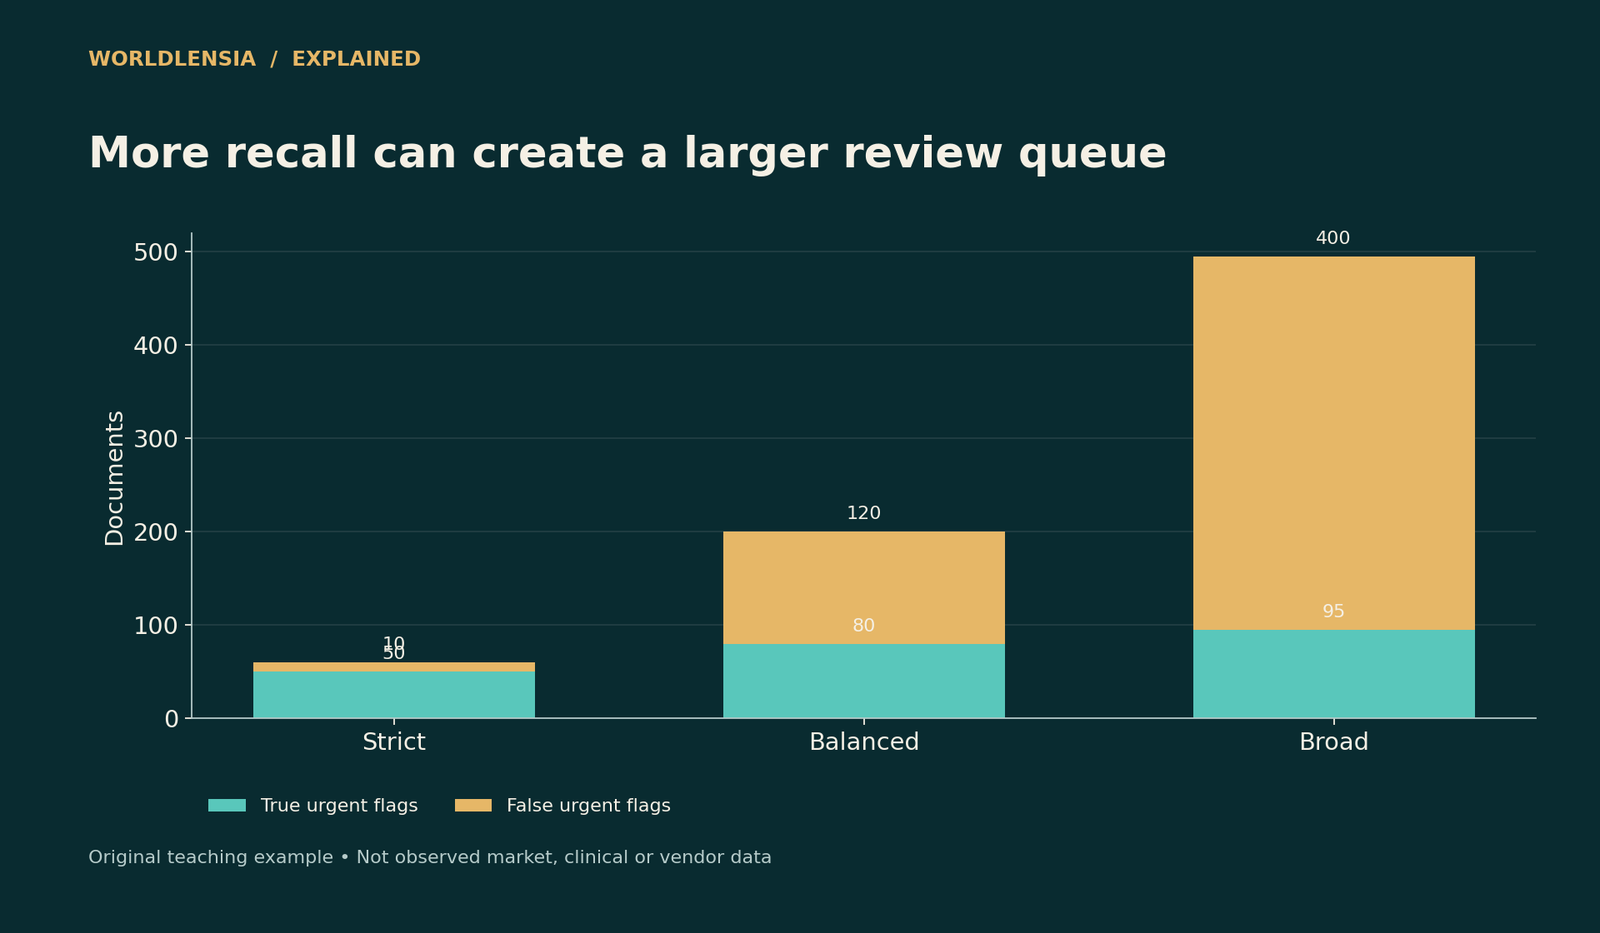
Figure data and assumptions
Original hypothetical teaching data; see the caption and article for assumptions.
| Category | True urgent flags | False urgent flags |
|---|---|---|
| Strict | 50.0 | 10.0 |
| Balanced | 80.0 | 120.0 |
| Broad | 95.0 | 400.0 |
Precision is 80 ÷ 200, or 40%. Recall is 80 ÷ 100, or 80%. Accuracy is (80 + 9,780) ÷ 10,000, or 98.6%. The all-routine baseline had higher accuracy, but it found no urgent items. The useful comparison depends on the consequences of misses and unnecessary reviews.
These are also workload numbers. The proposed system creates 200 review tasks, including 120 that do not meet the urgent definition. Reporting only “80% recall” would leave the review manager unable to estimate staffing. Reporting only “40% precision” could obscure the fact that most urgent items were found.
3. Check how thresholds change precision and recall
Many classifiers output a score before a rule converts that score into an action. A lower threshold generally flags more items. Whether the additional flags are useful must be measured. Precision can rise or fall as particular items enter the queue; it is not guaranteed to move smoothly.
Consider three fictional operating points on the same labeled collection:
| Policy | True positives | False positives | False negatives | Precision | Recall |
|---|---|---|---|---|---|
| Strict | 50 | 10 | 50 | 83.3% | 50% |
| Balanced | 80 | 120 | 20 | 40% | 80% |
| Broad | 95 | 400 | 5 | 19.2% | 95% |
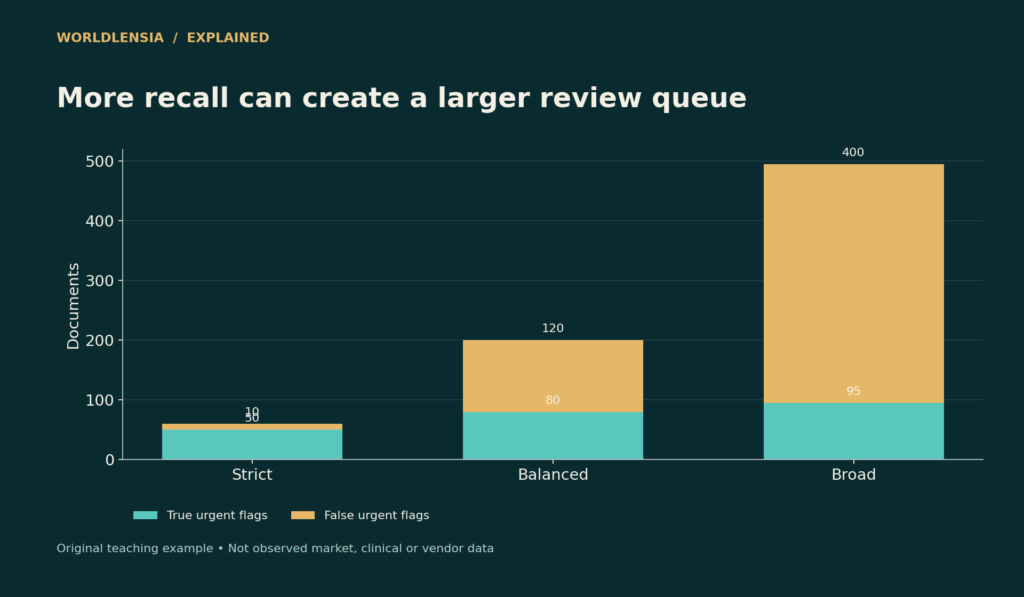
The strict policy creates 60 reviews; the balanced policy creates 200; the broad policy creates 495. Moving from balanced to broad finds 15 additional urgent files while adding 280 unnecessary reviews. That is about 18.7 additional false flags for every additional urgent item found. This incremental comparison is often more useful than declaring one threshold “best.”
The chart accompanying this article compares those counts. It is not a measured precision-recall curve and should not be interpreted as one. A real curve requires predictions across many thresholds on the same evaluation set.
4. Translate errors into consequences carefully
Suppose an unnecessary review costs $2 and a missed urgent document creates an expected operational loss of $100. This is a hypothetical cost model, not an estimate of legal exposure or a recommendation for a real organization.
The strict policy produces an illustrative error cost of (10 × $2) + (50 × $100) = $5,020. Balanced produces $2,240. Broad produces $1,300. Under these assumptions broad looks preferable, even though it has the lowest precision. If the cost of a miss changes to $10, the totals become $520, $440, and $850. Balanced then looks preferable.
The reversal is the lesson. A metric does not supply the business valuation of an error. That valuation must come from the people responsible for the workflow, with appropriate attention to harms that cannot reasonably be reduced to one dollar figure. A model should not select who receives an essential service simply because a spreadsheet assigns a convenient average cost.
Staff capacity creates another constraint. If reviewers can examine 250 files per day, the broad policy generates a backlog on the first day of this workload. An apparently lower error cost may be unattainable if delayed reviews cause more harm. Add queue time and review quality to the test instead of assuming that human review is unlimited and perfect.
5. Read F1 alongside precision and recall
F1 combines precision and recall through their harmonic mean: 2 × precision × recall ÷ (precision + recall). For the balanced example it is approximately 53.3%. This can help compare systems when the two dimensions deserve similar attention, but it hides the separate queue and miss counts.
Two systems can share a similar F1 score while producing different operational problems. One may find fewer urgent documents with a clean queue; another may find more while overwhelming reviewers. Retain the component metrics and the underlying counts. A summary should make a report easier to navigate, not replace the evidence needed to act.
Also record what happens when a denominator is zero. If the model flags nothing, precision is not an ordinary measured proportion of successful flags because there are no flags. Software packages use defined conventions for this case. State the convention rather than presenting an unexplained zero or treating the result as perfect performance.
6. Keep development and evaluation separate
Use one collection to develop prompts or train the classifier, another to choose thresholds, and a protected test collection to estimate final performance. If the same examples repeatedly guide changes, the team can gradually optimize for that collection rather than for future work.
Split by the unit that creates dependence. If several near-identical invoices come from one supplier, a random file split can place related versions in both development and test sets. A supplier-level or time-based split may better represent the intended deployment. The appropriate choice depends on whether future tasks involve existing suppliers, new suppliers, or both.
Preserve difficult cases instead of dropping them after an error. Mark unreadable scans, conflicting records, unfamiliar formats, and cases without sufficient evidence. An “unable to determine” outcome can be appropriate if the production workflow also supports it. Excluding all difficult files from evaluation would create a false picture of readiness.
7. Test the labels used to measure precision
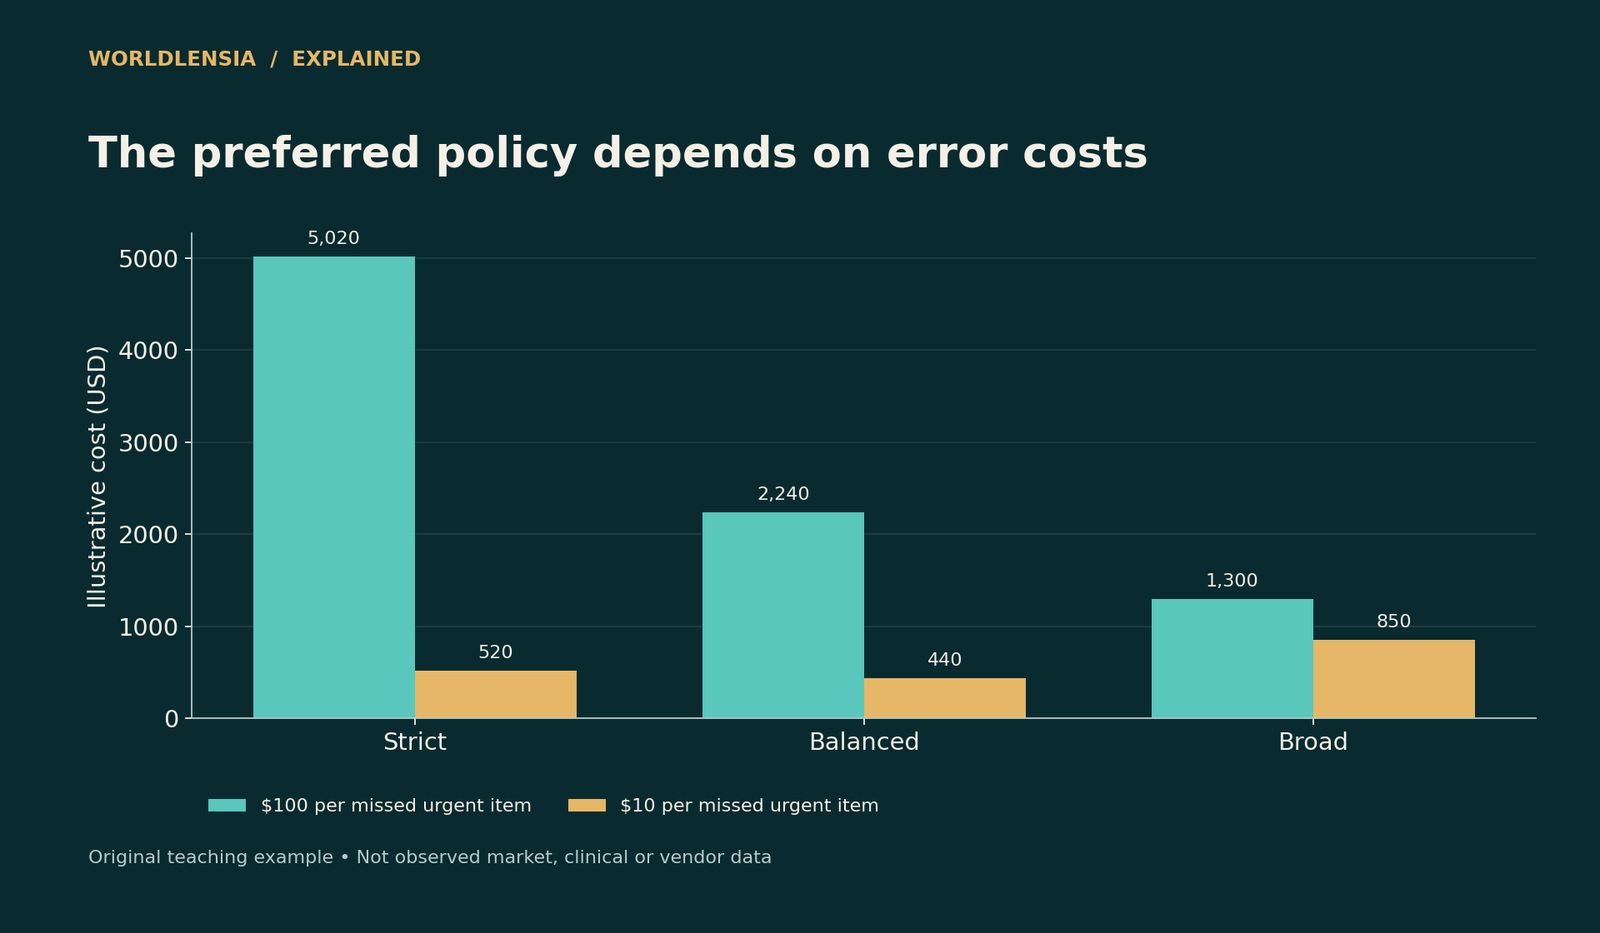
Figure data and assumptions
Original hypothetical teaching data; see the caption and article for assumptions.
| Category | $100 per missed urgent item | $10 per missed urgent item |
|---|---|---|
| Strict | 5020.0 | 520.0 |
| Balanced | 2240.0 | 440.0 |
| Broad | 1300.0 | 850.0 |
Have two qualified reviewers independently label a sample and compare disagreements. A dispute might reveal an ambiguous policy, missing evidence, or a genuine mistake. Resolve the rule and keep a record of the change. Do not change the reference label merely to make a favored model look correct.
For complex work, there may be more than one defensible answer. A single rigid reference can penalize reasonable alternatives. In that setting, use a rubric with specific criteria and an adjudication process. Keep binary metrics for questions that are actually binary, such as whether a cited invoice number appears in the underlying record.
If reviewers see the model's answer before making their own judgment, they may be influenced by it. A blinded labeling stage can help reveal that risk. Later, test the real combined workflow, because independent model performance and model-assisted human performance answer different questions.
Compare important slices
A collection-wide average can conceal weak performance on low-quality scans, uncommon languages, long documents, or files from a new source. Report counts and metrics for slices that matter operationally. Avoid creating tiny slices and treating their percentages as stable findings.
For example, a model might identify 76 of 80 urgent digital files but only 4 of 20 urgent scanned files. The total recall is still 80%, yet recall for scanned urgent files is 20%. That difference suggests a specific investigation into extraction quality. It does not prove that the language model itself caused the problem.
Follow the full chain: source capture, text extraction, retrieval, classification, routing, and review. A system can fail because the relevant page never reached the model. Rewriting the final prompt would then address the wrong stage.
Treat uncertainty as part of the result
An observed 80 out of 100 is an estimate from a particular collection, not a promise about the next 100. The confidence one can place in it depends on sampling, labeling, and deployment similarity. A very large but unrepresentative test can still be misleading.
Include evaluation sample sizes and a suitable uncertainty method where statistical inference is intended. For correlated documents, a calculation that assumes every file is independent can make the uncertainty appear smaller than it is. Specialist statistical advice may be needed for consequential deployments.
An honest report might say that the model found 80 of 100 labeled urgent cases in a specified test, with weaker results on scanned documents, and that new-source performance remains untested. That is more actionable than announcing that the system is “80% reliable.”
Monitor after launch
Production data can change. The share of urgent files may rise, suppliers may adopt a new template, or an extraction service may change. These shifts can alter precision, workload, and error patterns even if the classifier configuration stays fixed.
Monitor flag counts immediately, but avoid estimating recall solely from reviewed flags. The missed items are in the unflagged group. Periodically audit an appropriate sample from that group as well. Keep sampling probabilities if the audit oversamples suspicious records so estimates can be interpreted correctly.
Record model, prompt, retrieval, extraction, and threshold versions. If performance changes after several components change at once, the cause becomes difficult to locate. A rollback plan and a clear owner reduce the chance that a temporary experiment becomes an unexplained permanent policy.
A compact evaluation worksheet
Before approving a document classifier, complete these fields: target label, action taken, eligible population, sampling method, reference-label process, development split, threshold-selection set, untouched test set, confusion matrix, slice results, reviewer capacity, response time, and rollback trigger.
Add a note on what the study does not establish. It may not cover multilingual documents, unusual attachment formats, changing document versions, or a new business unit. Explicit boundaries make the result more useful because colleagues can see when they need additional testing.
For retrieval systems, use WorldLensia's existing RAG-versus-fine-tuning guide to distinguish a missing-evidence problem from a behavior problem. For generative answers, pair this evaluation with the source-ledger approach: finding the right class does not establish that an explanation is grounded in an actual source.
Questions that expose a weak comparison
Ask whether both candidates saw the same files and whether their input quality was identical. If one system had a better extraction pipeline or more current records, a simple model-name comparison is incomplete. Compare the entire configuration and document the difference.
Ask whether failed requests counted as failures. A service that returns excellent labels for easy cases but times out on difficult files should not receive a score calculated only from completed responses. Report completion rate and label quality separately, then show the combined success rate for eligible tasks.
Ask who chose the threshold and when. A threshold selected after inspecting the final test results makes those results part of development. The remedy is a new evaluation, not a footnote that leaves the headline unchanged.
Finally, ask what would change the deployment decision. If no possible result could cause the team to reject or limit the system, the exercise is a demonstration rather than a meaningful evaluation. Predefined acceptance criteria make it possible for evidence to affect the outcome.
A deployment comparison should include abstention
A classifier does not always need to force every document into urgent or routine. A third outcome can route unclear cases to a separate review process. That option changes the workload and needs its own evaluation. Report how many files receive a decision, how many are deferred, and how often each group contains urgent items.
For example, suppose a system labels 9,000 of the 10,000 files automatically and defers 1,000. A high score on the automatically labeled group does not establish performance on the full collection. If most difficult or urgent files are deferred, the human process remains central to overall success. Coverage and quality should be reported together.
Define a service promise for deferred files too. An unresolved queue that grows indefinitely can turn abstention into a hidden failure. Assign ownership, response time, and the evidence required to close each case. In the final report, distinguish a correct automated decision, a correct human-assisted decision, and a case that never reached resolution.
This makes it possible to compare automation policies honestly. A system that handles fewer tasks with strong evidence can be useful, but its scope should be visible rather than described as if every incoming document received the same level of successful automation.
Practical conclusion
Choose precision, recall, and accuracy around the action the system supports. Publish the counts, compare a sensible baseline, make threshold trade-offs visible, and include review capacity. Then test the combined workflow on representative data and monitor the misses as well as the flags.
The strongest evaluation is not the one with the most impressive single number. It is the one that shows exactly what was tested, what failed, and what must be true before the result can be used elsewhere.
Sources and methodology
Definitions were checked against the scikit-learn precision-recall documentation and NIST's Contingency tutorial on October 18, 2026. All document counts, threshold policies, dollar costs, and scenario conclusions in this article are WorldLensia's original hypothetical examples. They are not vendor benchmarks or observed business results.
- scikit-learn: Precision-Recall — checked October 18, 2026.
- NIST: Contingency tutorial — checked October 18, 2026.
Continue with AI benchmarks and task success and Build a source ledger for related context.
To connect evaluation metrics with confidence checks, see AI Benchmark Accuracy vs Task Success: Build a Fair Test and AI Probability Calibration: Does an 80% Score Mean What You Think?.