

Index rebasing can change a series reference level without prices falling. If the publisher applies the same factor to every value, percentage movements between matching observations stay the same. If the publisher has changed the reference base, every value may simply have been multiplied by the same factor. The displayed levels change, while the percentage movement between matching observations stays the same.
Before interpreting an apparent jump in a chart, check whether the series was rebased, revised, reweighted or replaced. Those are different operations. This article isolates a pure rebasing calculation so its consequences are easy to see.

What index rebasing changes
An index expresses a numerical series relative to a reference level. Setting a selected period to 100 makes subsequent levels easier to compare with that period. It does not mean the measured item costs $100, and an index value is not a currency price.
The Bureau of Labor Statistics explains reference bases in its CPI frequently asked questions and provides base-conversion information. The reference base is part of how an index is presented. Understanding that presentation is separate from understanding which spending categories enter the CPI or how their weights change.
A worked example with invented numbers
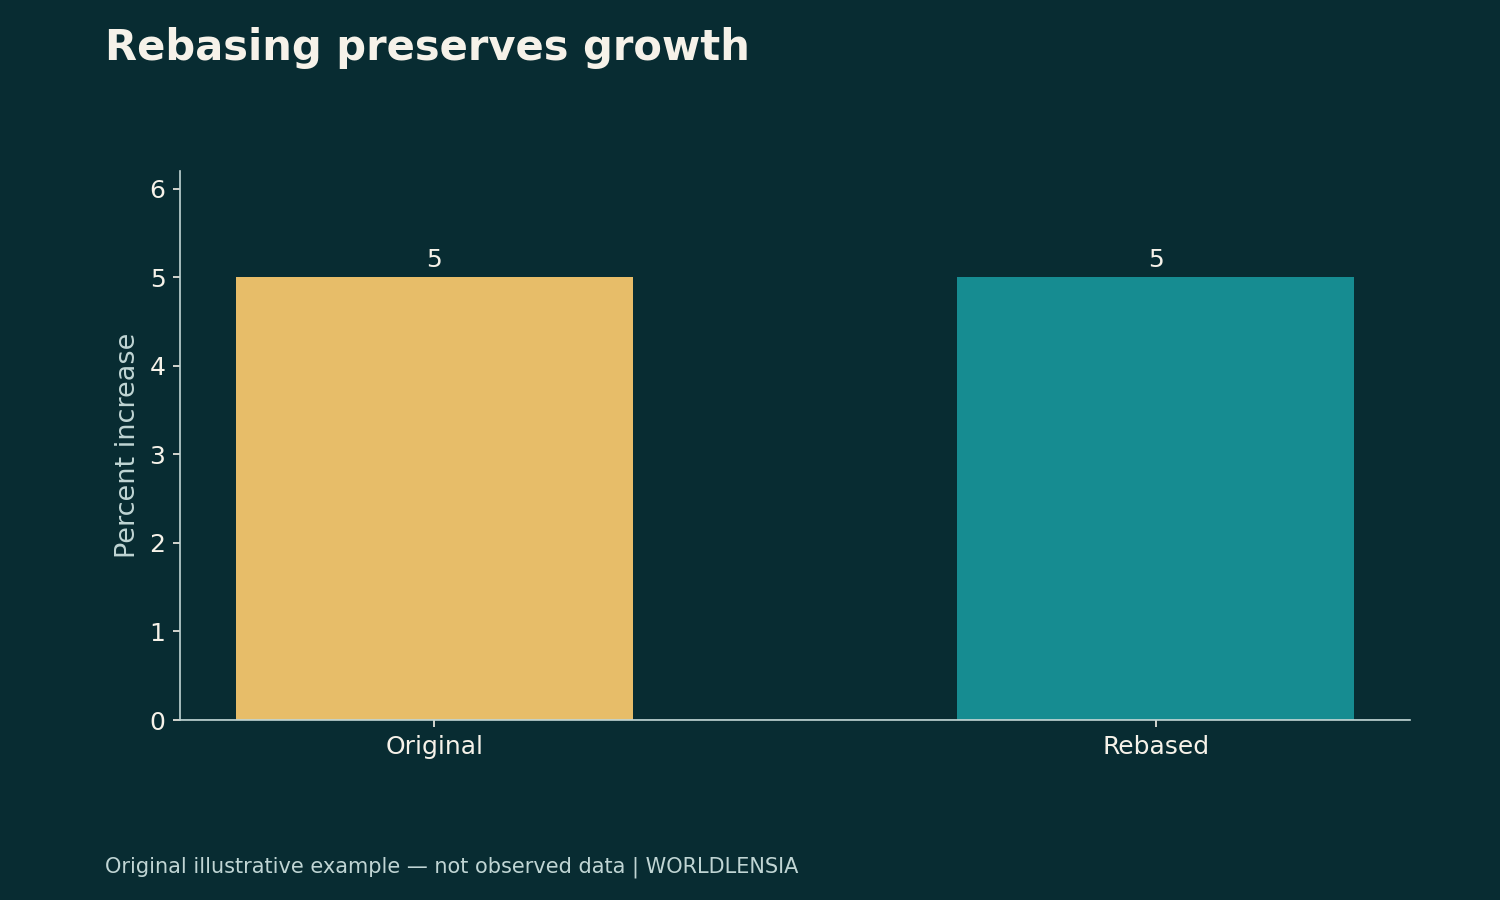
Suppose a fictional index has values of 120 in period A and 126 in period B. The percentage change is the later value divided by the earlier value, minus one:
126 ÷ 120 − 1 = 0.05, or 5%.
Now make period A equal to 100. The conversion factor is 100÷120, or approximately 0.833333. Multiply both observations by that factor. Period A becomes 100 and period B becomes 105.
| Period | Original index | Rebased index |
|---|---|---|
| A | 120 | 100 |
| B | 126 | 105 |
| Percentage change | 5% | 5% |
The new calculation is 105÷100−1=5%. No economic event was introduced by the conversion. These invented values are not observations from the CPI or another official series.
Why the factor cancels
Call the original observations X and Y, and the common positive conversion factor c. The rebased ratio is (cY)÷(cX). The c in the numerator cancels the c in the denominator, leaving Y÷X. Subtracting one therefore produces the same percentage change.
The size of the index-point difference does change. The original difference was six points; the rebased difference is five points. That is why a statement about index points must identify the series and its base. A statement about percentage growth between the same observations survives a pure common-factor rebasing.
Rounding can create small display differences. If a publisher rounds each level before you calculate growth, your result may differ slightly from a change calculated using unrounded values. Use the published change or adequate precision, and explain the convention when the difference matters.
Do not mix bases inside a calculation
Dividing the new period-B value, 105, by the old period-A value, 120, would suggest a decline of 12.5%. That result is a unit mismatch. The two numbers use different scales and do not form a valid growth comparison.
Store the base alongside every series you download. When combining files from different releases, verify that the observation dates, reference base, seasonal-adjustment status and underlying series identity match. A familiar title alone is not enough to establish compatibility.
For another common compatibility issue, read seasonally adjusted versus unadjusted data. Adjustment changes the treatment of recurring seasonal movements; it is not the same operation as multiplying an entire series by a constant.
Rebasing is not every methodological change
A pure rebasing holds the underlying numerical relationships fixed. A revision may replace source observations. New weights or a changed formula can alter measured movements. A new product universe can change what the series represents. Do not use the cancellation argument to claim that all revisions leave growth unchanged.
Ask the publisher what changed and read the technical note. If the change is only the reference scale, convert the observations consistently. If the economic definition or method changed, investigate comparability rather than forcing the series together with a multiplier.
A practical chart check
The chart label should identify the measure and its reference base, such as “illustrative index, period A=100.” Show percent changes as percent changes and levels as index levels. Avoid a currency symbol unless the plotted series actually uses currency units.
WorldLensia's personal inflation and CPI spending-weight guide addresses a different question: why households can experience different price changes. Changing the reference number on an index does not change a household's purchases or its bills.
Sources and methodology
Index-reference concepts were checked against the BLS CPI frequently asked questions on October 19, 2026; a publication/update date was not established in the retrieved text. All index values and the mixed-base mistake above are original hypothetical examples. No current inflation rate or market forecast is asserted.
To distinguish reference scaling from real growth and percentage changes, see Nominal vs Real GDP: How to Separate Prices from Growth and Percent vs Percentage Points: Avoid a Misleading Comparison.