
Two places can have the same health rates within each age group yet show different overall rates because their populations have different age structures. Age adjustment helps make comparisons more informative. It does not replace the actual number of people who need services.
At a glance
- Crude rates describe observed events relative to the actual population.
- Age-adjusted rates use a standard age distribution for comparison.
- Compare adjusted rates only when the standard and methods are compatible.
Why the population mix matters
CDC explains that age-adjusted rates use the age distribution of a standard population. This helps compare places with different age structures. In U.S. cancer statistics, the 2000 U.S. standard population is used for consistency; values adjusted to different standards should not be treated as directly comparable.
An adjusted rate is a statistical summary, not the observed event count divided by the actual population. For service planning, counts, crude rates, age-specific rates, and adjusted rates can each contribute different information.
A fictional two-age-group example
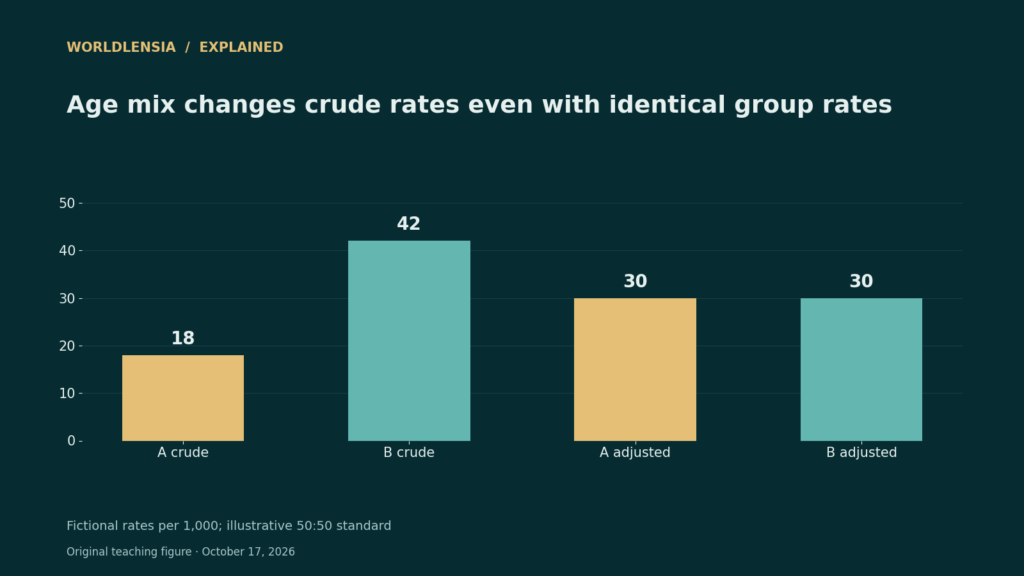
Assume the event rate is 10 per 1,000 in a younger group and 50 per 1,000 in an older group in both Place A and Place B. Place A is 80% younger and 20% older, giving a crude rate of 18 per 1,000. Place B is 20% younger and 80% older, giving a crude rate of 42 per 1,000.
Using an invented standard that is 50% younger and 50% older gives an adjusted rate of 30 per 1,000 for both places. The example isolates age composition by holding the age-specific rates equal. It uses only two groups for teaching and is not an official adjustment method or a finding about real communities.
State what the comparison cannot prove
Age adjustment does not control every possible difference between populations. Access to diagnosis, reporting completeness, definitions, and other characteristics can still affect interpretation. A rate comparison alone does not identify a cause.
Check the outcome definition, period, denominator, standard population, and uncertainty before writing a conclusion. If small counts are suppressed or estimates are unstable, preserve that limitation. A blank cell does not necessarily mean that no events occurred.
A practical comparison
| Fictional place | Crude rate / 1,000 | 50:50 adjusted rate / 1,000 |
|---|---|---|
| Place A | 18 | 30 |
| Place B | 42 | 30 |
Before using the result
- Use the same standard population.
- Keep counts and adjusted rates distinct.
- Do not infer causes from the adjusted comparison alone.
Continue exploring: our public-health data explainers.
Recalculate the example with explicit weights
The fictional crude rates are weighted averages: Place A gives 0.80 × 10 + 0.20 × 50 = 18 events per 1,000; Place B gives 0.20 × 10 + 0.80 × 50 = 42. Applying the same invented 50:50 standard gives 30 for each place. The adjusted equality follows from identical age-specific rates, not from evidence that the places have identical service needs.
For real comparisons, retain the standard population, age bands and uncertainty. CDC notes that different age groups can produce different adjusted estimates even when the standard year matches. Also distinguish incidence from prevalence and reported from measured health data. These are population-data comparisons, not individual risk estimates.
Sources and methodology
Reviewed October 17, 2026. WorldLensia explanatory analysis. Worked examples and the accompanying teaching figure are illustrative, not measured findings or product tests. Consult the linked source for definitions and revisions.
To distinguish a population-level comparison from individual risk, see County Health Maps: A Place-Level Pattern Does Not Identify Individual Risk.