
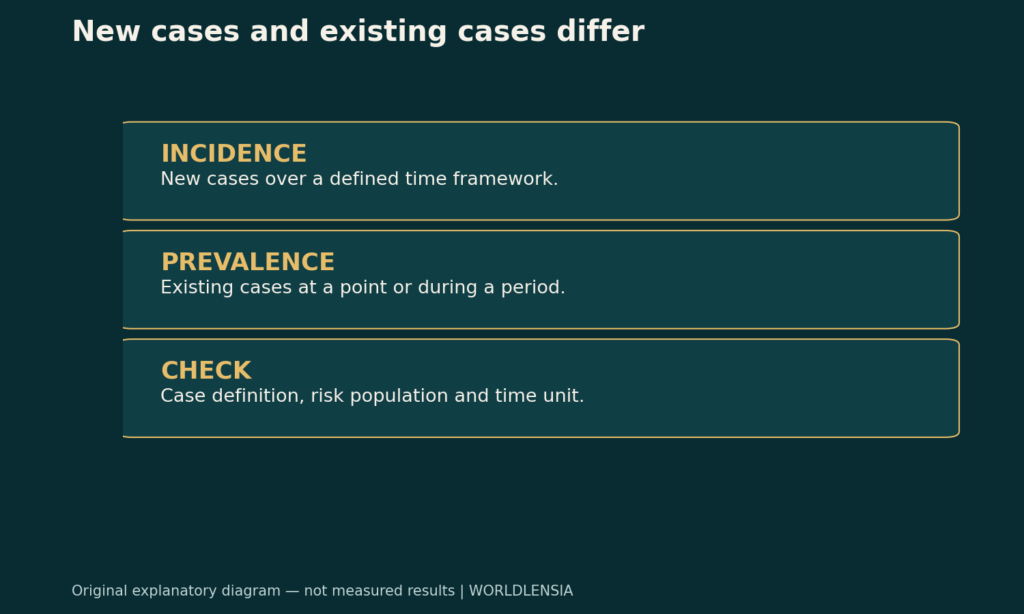
Incidence and prevalence describe different measures: incidence counts new cases over a defined period, while prevalence counts existing cases at a point or during a specified period. Comparing the percentages without those definitions can create a false contradiction.
Begin by asking who is counted, who belongs in the denominator and which period the measure describes. The label “rate” is not enough to establish compatibility, especially when one figure is a proportion and another uses person-time.
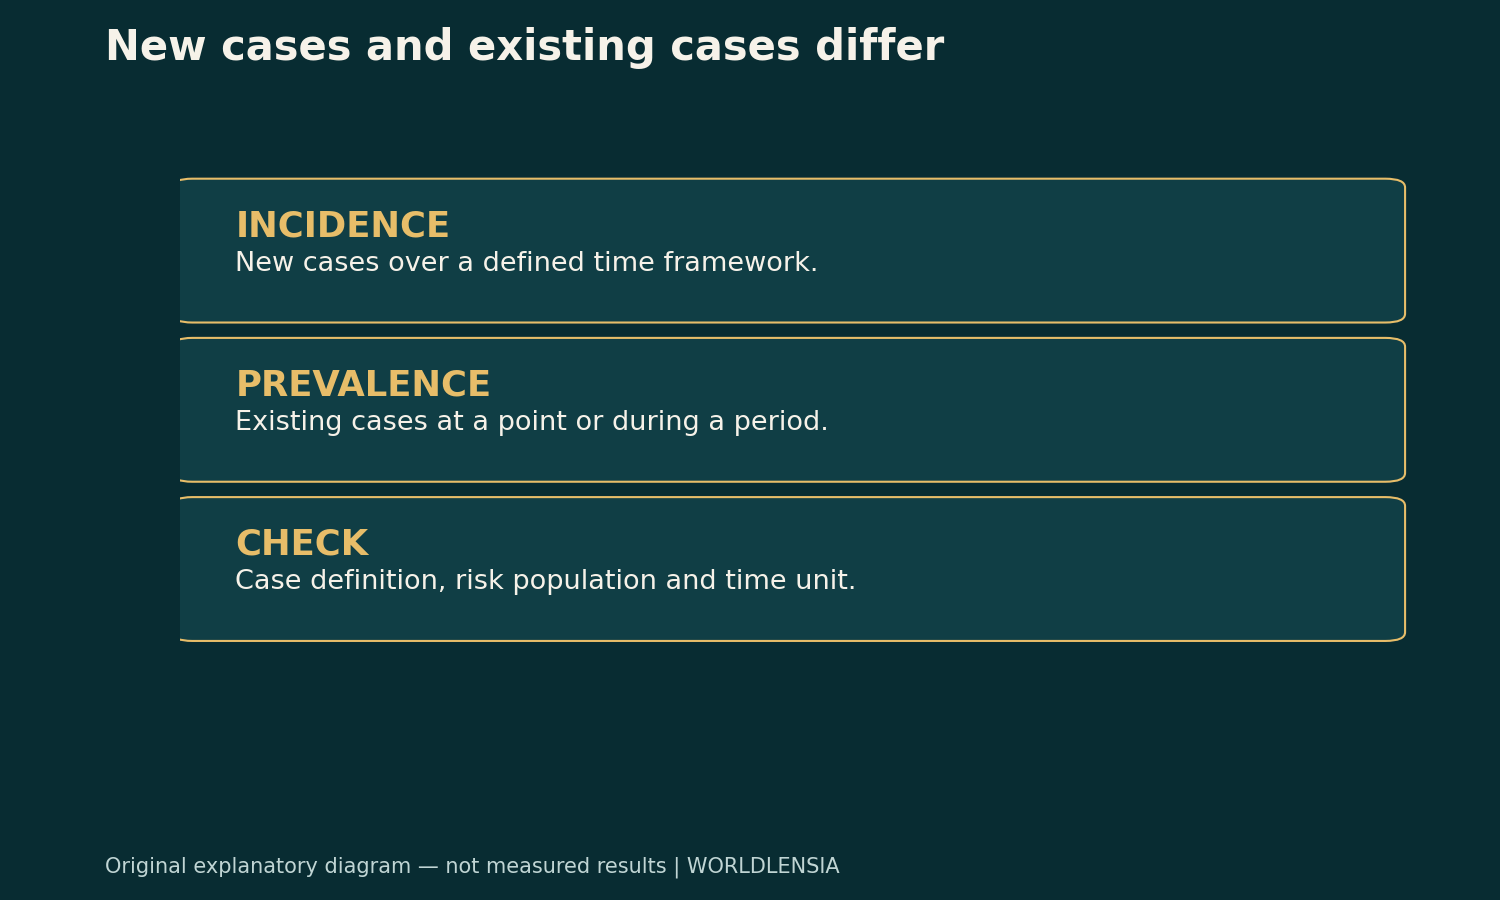
Incidence and prevalence start with different case counts
Incidence concerns new cases within a defined time framework. An incidence proportion follows a population initially at risk and asks what fraction becomes a case over the stated period. A person-time incidence rate uses accumulated time at risk in its denominator.
Those are different constructions. The first can be expressed as a percentage over a defined interval under the appropriate assumptions. The second has a time-based unit, such as cases per person-year. Do not remove that unit and describe the result as though it were the same percentage.
The CDC's archived epidemiology teaching material distinguishes these measures. It is a definitions source, not a statement of current disease frequency or a recommendation about individual diagnosis.
Prevalence starts with existing cases
Point prevalence concerns cases present at a defined point in time within the relevant population. Period prevalence concerns cases present during a specified period under the source's definition. A report must identify which construction it uses.
Prevalence is not simply a count of new events. People who developed the condition earlier can still be cases at the measurement point. Duration, recovery, deaths, migration and the measurement definition can affect the observed population account.
Do not infer the cause of a prevalence change from its direction alone. A larger measured proportion could reflect more new cases, longer duration, changed detection or other factors. Identifying which explanation applies requires additional evidence.
A fictional closed-population example
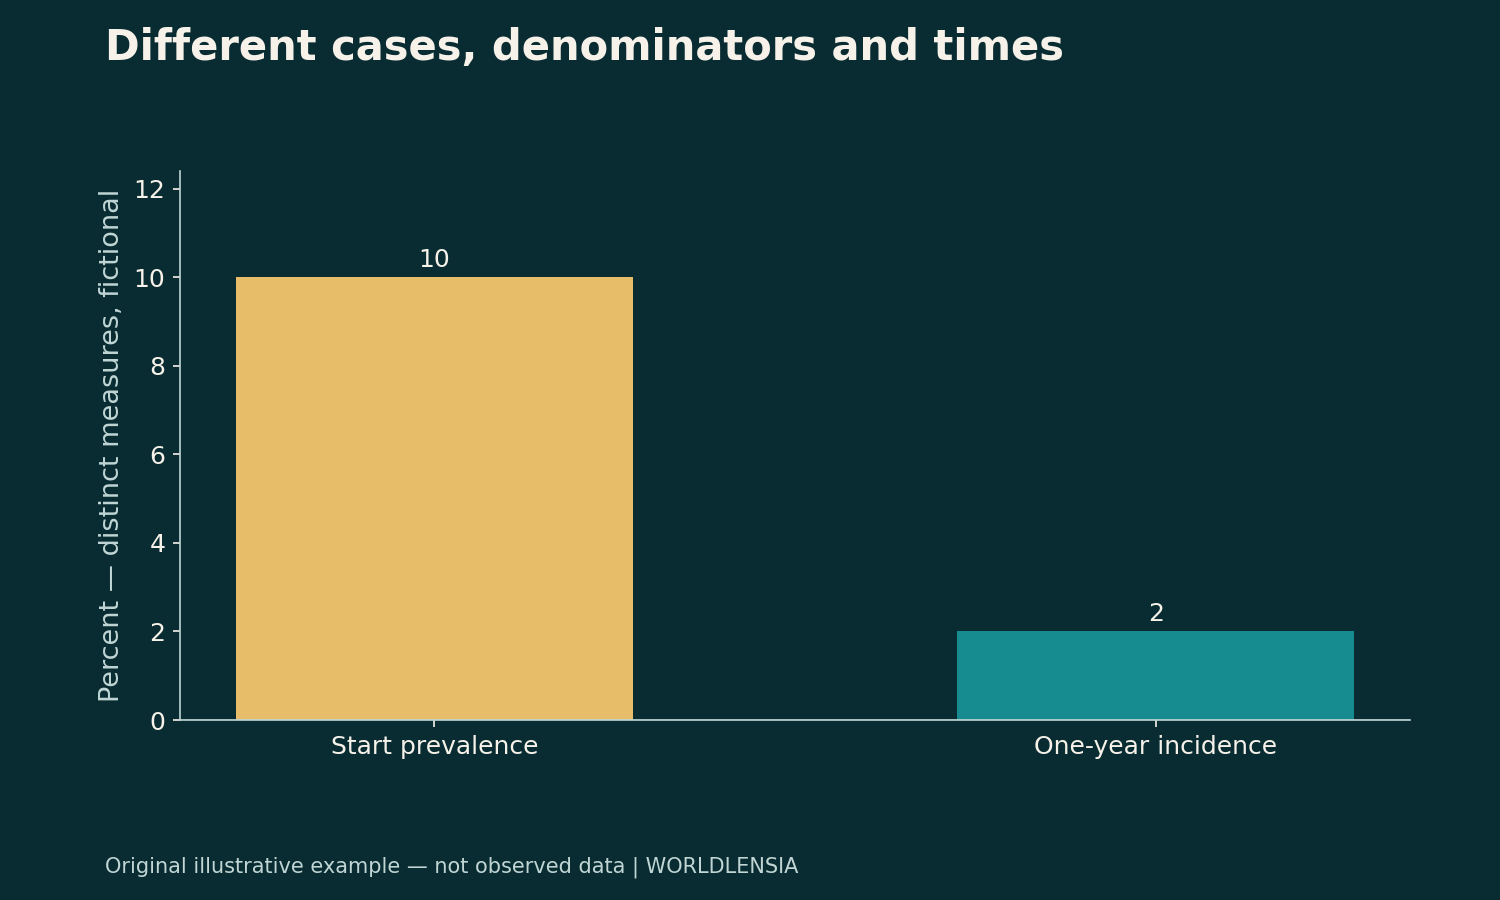
Imagine a closed population of 1,000 people at the start of a year. One hundred already have the defined condition, leaving 900 initially at risk of becoming a new case in the simplified model. During the year, 18 of those 900 become cases.
The start-point prevalence is 100÷1,000=10%. The incidence proportion over the year is 18÷900=2% among those initially at risk.
| Synthetic measure | Numerator | Denominator | Result |
|---|---|---|---|
| Start-point prevalence | 100 existing cases | 1,000 people | 10% |
| One-year incidence proportion | 18 new cases | 900 initially at risk | 2% |
Neither percentage contradicts the other. The first describes a starting state. The second describes new cases in a different denominator over time. The values are invented and do not describe any disease or real population.
End-of-year prevalence needs more information
It might be tempting to add 18 to 100 and report 118 cases at year-end. That would require assumptions about what happened to the original and new cases, as well as the population. The supplied information does not state recovery, deaths or other exits from the case definition.
If the model explicitly assumes no recovery, no deaths, no migration and continued case status, the addition can be part of that model. Without those assumptions, it is an unsupported conclusion. State the population account before calculating the endpoint.
This is a useful discipline for reading actual reports. A table of incident diagnoses may not contain the information needed to calculate the number currently living with a condition. Look for a compatible prevalence source rather than improvising one from incomplete flows.
Case definitions belong beside the time period
“New case” can depend on a diagnosis rule, a first recorded event or another defined threshold. A repeated event may be treated differently from a first event. The appropriate population at risk also depends on that definition.
Do not apply the simple closed-population example automatically to recurrent conditions or situations where people enter and leave risk. A more suitable design may need person-time, episode definitions or other methods. Read the source protocol before deciding which calculation is valid.
Detection can affect reported counts as well. A change in testing or record availability can change observed diagnoses without proving an equivalent change in underlying occurrence. That is a measurement question to investigate, not a reason to dismiss every increase.
Population comparisons need compatible methods
Two places can report the same named condition using different age groups, observation windows or case definitions. A direct percentage comparison may therefore combine unlike measures. Check the numerator and denominator rather than relying on a common headline label.
The age-adjusted versus crude-rate guide explains another issue in population comparisons. Age composition and case timing are separate checks; solving one does not eliminate the other.
Diagnostic performance is another distinct subject. The sensitivity, specificity and predictive-value guide explains why the probability of a condition given a test result is not the same as a test's sensitivity. Keep those probabilities separate from the population-frequency measures discussed here.
Write a claim that preserves the measure
A useful sentence identifies whether the result concerns existing cases at a date, cases during a period or new events over follow-up. It gives the population and includes the time unit when one is part of the denominator.
For the fictional account, say that 2% of the 900 initially at-risk people became new cases during one year, while 10% of the full population were cases at the start. Readers can then understand why the measures differ without assuming an error.
Keep a population account beside the percentage
When follow-up includes entries, exits or changing risk status, a simple starting denominator may not answer the intended rate question. Identify who contributes time and when a person becomes or ceases to be at risk under the study definition.
Do not extend the fictional 18-out-of-900 calculation to a different design by changing only the label. The source method should determine whether a proportion, a person-time rate or another measure is appropriate.
A small population-flow diagram can make those assumptions clearer than a long decimal percentage. The visual should label the case definition and observation window as carefully as the text.
A case count needs a unit
State whether the numerator counts people, episodes or diagnoses. Those units can differ when one person contributes more than one event, so they should not be exchanged silently.
Sources and methodology
Definitions were checked against the CDC archive's Principles of Epidemiology, Lesson 3, Section 2 on October 19, 2026. This is archived educational material; its publication/update date was not established in the retrieved text. All counts and percentages are original hypothetical examples. No current prevalence estimate, clinical advice or diagnosis is provided.
To retain age composition and baseline risk in case comparisons, see Age-Adjusted vs Crude Health Rates: Compare Populations Fairly and Absolute vs Relative Risk: Put Health Headlines in Context.