
A diagnostic test's sensitivity is not the probability that a person with a positive result has the condition. Those probabilities begin with different groups. Sensitivity starts among people who have the condition; positive predictive value starts among people who tested positive.
The distinction matters when reading health headlines and study summaries. It does not replace clinical interpretation. The examples here use a completely hypothetical condition and test. They are educational arithmetic, not advice about screening, diagnosis, treatment, or any individual's result.
1. Define sensitivity, specificity and the four outcomes
A test can be positive or negative, and the reference classification can indicate presence or absence of the condition. Their combination produces true positives, false positives, true negatives, and false negatives.
Sensitivity is true positives divided by all people with the condition. Specificity is true negatives divided by all people without it. Positive predictive value divides true positives by all positive tests. Negative predictive value divides true negatives by all negative tests.
These formulas need a valid basis for deciding the reference classification. FDA guidance on diagnostic-test reporting discusses study design, reference standards, and appropriate reporting. A comparison against another imperfect test may require agreement terminology rather than casually claiming sensitivity and specificity against truth.
2. Work through a low-prevalence example
Imagine 10,000 people, with 1% actually having the hypothetical condition. That means 100 with it and 9,900 without it. Assume sensitivity is 90% and specificity is 95% in this constructed population.
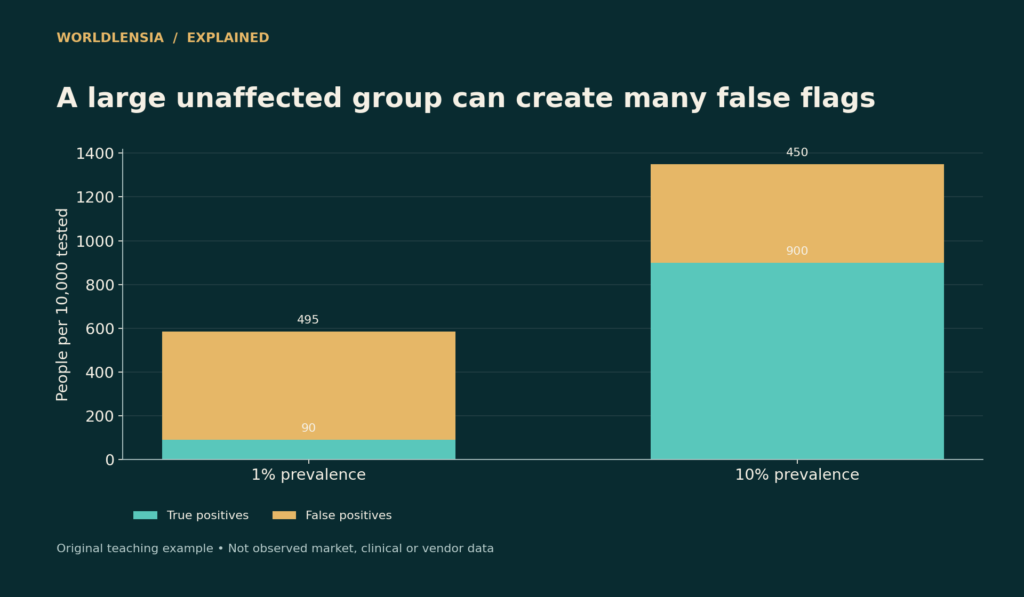
Of the 100 with the condition, 90 test positive and 10 negative. Of the 9,900 without it, 9,405 test negative and 495 positive. There are 585 positive tests in total, of which 90 are true positives. Positive predictive value is 90 ÷ 585, approximately 15.4%.
| Reference classification | Positive test | Negative test | Total |
|---|---|---|---|
| Condition present | 90 | 10 | 100 |
| Condition absent | 495 | 9,405 | 9,900 |
| Total | 585 | 9,415 | 10,000 |
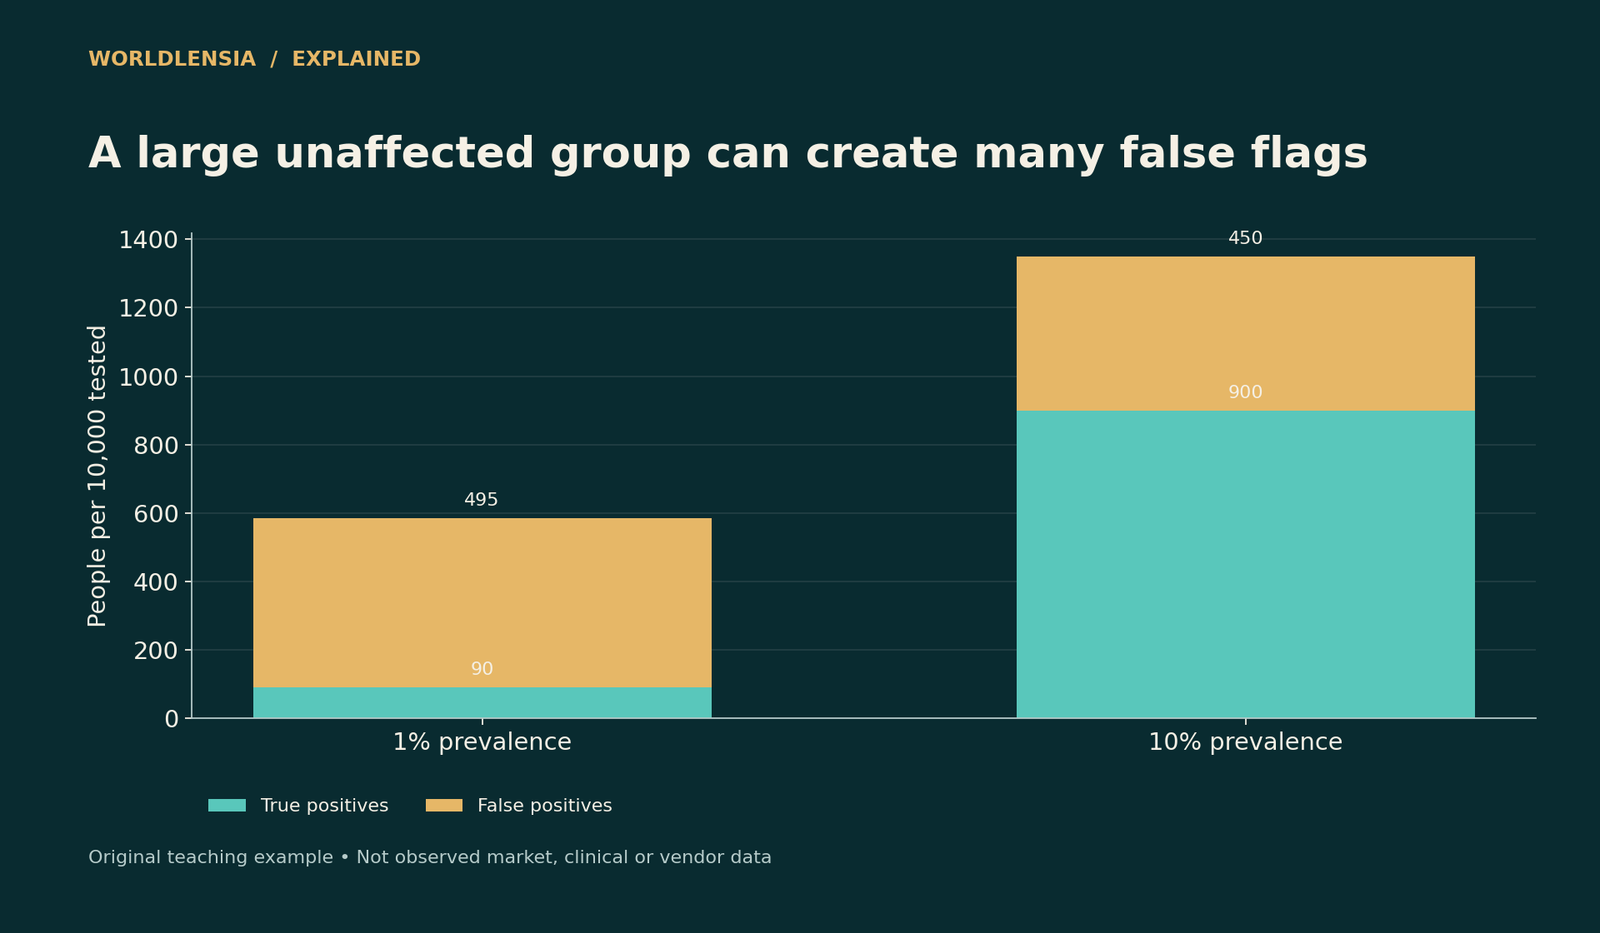
Figure data and assumptions
Original hypothetical teaching data; see the caption and article for assumptions.
| Category | True positives | False positives |
|---|---|---|
| 1% prevalence | 90.0 | 495.0 |
| 10% prevalence | 900.0 | 450.0 |
The sensitivity is still 90%. The positive predictive value is much lower because the group without the condition is large enough to generate many false positives even with 95% specificity. The calculation is a conditional-probability lesson, not a criticism of a particular test.
3. Change prevalence while holding performance fixed
Now use a fictional population of 10,000 with 10% having the condition. Under the same assumed sensitivity and specificity, there are 900 true positives, 100 false negatives, 450 false positives, and 8,550 true negatives.
Positive predictive value becomes 900 ÷ 1,350, or 66.7%. The test assumptions did not change; the starting population did. The accompanying chart compares these two populations and labels the fixed-performance assumption explicitly.
In real settings, sensitivity and specificity themselves may also vary with population characteristics, disease spectrum, sampling, specimen handling, and timing. Holding them fixed is an explanatory simplification, not proof that a study result transfers unchanged to every group.
4. Read negative results with the same discipline
In the 1% example, negative predictive value is 9,405 ÷ 9,415, about 99.89%. In the 10% example, it is 8,550 ÷ 8,650, about 98.84%. These values describe the constructed groups, not an individual's medical situation.
A high negative predictive value in a low-prevalence population can coexist with imperfect sensitivity. Reporting only the impressive negative figure can hide the number of affected people missed. Keep all four counts available.
5. Distinguish sensitivity from overall accuracy
Overall accuracy in the 1% example is (90 + 9,405) ÷ 10,000 = 94.95%. A rule labeling everyone negative would be correct for 99% of this fictional population while missing every affected person. Overall accuracy therefore cannot be the sole basis for evaluating a detection task.
The same mathematical issue appears in AI classification, but medical use requires clinical evidence and professional interpretation beyond the arithmetic. WorldLensia's precision-and-recall guide offers the nonclinical counterpart; it is not a validation method for medical devices.
6. Check how study design affects interpretation
Look for the study population, inclusion criteria, sample size, reference standard, missing results, and how uncertain or invalid tests were handled. A study made up of clearly affected patients and clearly unaffected volunteers can differ from a real clinical population containing borderline cases.
Timing can matter as well. A test evaluated at one stage of a condition may perform differently at another. A headline percentage stripped of those conditions can imply a generality the study does not establish.
7. Keep confidence intervals beside sensitivity estimates
Sensitivity measured from a small number of positive reference cases is uncertain. A result of 9 out of 10 and one of 900 out of 1,000 share a point estimate of 90%, but they do not contain the same amount of information.
Report counts and appropriate intervals from the study rather than inventing precision. Intervals also depend on method and assumptions. When summarizing a paper, preserve the reported approach and avoid implying that the interval describes every possible source of bias.

Figure data and assumptions
Original hypothetical teaching data; see the caption and article for assumptions.
| Category | Positive predictive value |
|---|---|
| 1% prevalence | 15.384615384615385 |
| 10% prevalence | 66.66666666666666 |
Do not assume repeated tests are independent
It may be tempting to multiply probabilities to interpret repeated results. That requires assumptions about dependence and the testing process. Two tests can share biological, technical, or sampling limitations, so a simple independence calculation can be misleading.
Clinical algorithms use more than a generic formula. Readers should follow qualified medical guidance and the instructions appropriate to the actual test and circumstances. A general data article cannot determine what an individual should do next.
Separate analytical and clinical claims
Laboratory detection limits and clinical diagnostic performance are different concepts. A claim that a method detects a small amount of material is not automatically a statement about sensitivity across patients in real use.
Read exactly what was measured and against what standard. Keep specimen types, target conditions, settings, and intended uses attached to the result. A number transferred from one context to another can become misleading even when quoted accurately.
A careful way to summarize a study
State the test, intended use, population, reference method, counts, sensitivity, specificity, predictive values where appropriate, and uncertainty. Explain whether the predictive values use observed prevalence or an assumed prevalence scenario.
Avoid saying that a 90% sensitivity means a positive result is 90% certain. Instead identify which group supplies the denominator. That one sentence can prevent the central probability reversal.
Report exclusions and invalid results
A study can appear stronger if difficult, indeterminate, or invalid results disappear from the denominator. Read how many participants were eligible, tested, excluded, and analyzed. The reasons for exclusion matter, especially when they are related to the test's performance.
Suppose a hypothetical device produces a valid output for 950 of 1,000 attempts. Accuracy among valid outputs and the 95% valid-result rate are separate observations. A user who receives no result has not received the same service as one receiving a correct answer.
Do not combine these numbers into a new clinical claim without an appropriate method. Simply preserve the denominators and describe the study's treatment of missing or indeterminate outcomes. Transparency is better than silently assuming every incomplete case would have been correct.
Keep absolute counts beside relative comparisons
A claim that false positives doubled can refer to an increase from one to two or from one thousand to two thousand. Both are a 100% relative increase, but their scale and uncertainty differ. Show the counts and population sizes.
Similarly, comparing predictive values between two groups requires attention to prevalence and study conditions. A difference does not automatically mean the laboratory method changed. The teaching examples demonstrate that the starting population alone can alter the conditional result under fixed performance assumptions.
WorldLensia's absolute-versus-relative-risk guide covers the related reporting habit: use both the proportion and the underlying scale. Readers should not have to infer a denominator from a dramatic adjective.
Ask whether the tested population matches the intended use
A study conducted in a specialist referral setting may involve a different distribution of cases from a general population setting. Prevalence can differ, and so can the range of conditions and practical testing circumstances. Do not transfer a predictive value without examining those differences.
The intended-use statement is therefore important evidence. A test evaluated for one purpose should not be assumed suitable for another simply because the underlying measurement sounds similar. A general article can identify that gap but cannot resolve it for an individual patient.
When summarizing research, separate the study's measured result from any extrapolation. If the paper models a different prevalence, call it a scenario. If no suitable evidence exists for a proposed application, say that the article cannot establish performance there.
Practical conclusion
Sensitivity and specificity describe performance conditional on reference status. Predictive values describe reference status conditional on the test result. Prevalence and study conditions help connect the two, but a real person's interpretation requires the actual clinical context.
Use the four-cell table, keep assumptions visible, and resist a single “accuracy” headline. The goal is to understand the evidence accurately, not to make a diagnosis from a teaching example.
Keep a source claim separate from a scenario
A study may report sensitivity and specificity from observed participants while a public explainer calculates predictive values at several assumed prevalences. Both can be useful, but their evidential status differs. Label which values were measured and which were modeled. If reproducing a table, verify the arithmetic and retain the assumptions about population and performance. Do not describe a hypothetical predictive value as a study finding. The same care applies to the visual examples in this article: their purpose is to show the probability structure, and every count is invented. A real medical interpretation needs the actual test, intended use, timing, and clinical context.
Finally, distinguish uncertainty about a population estimate from uncertainty about an individual result. A statistical interval around measured sensitivity does not directly supply an individual diagnosis. The study design, actual test, and clinical circumstances remain essential, and this educational calculation cannot replace their professional interpretation.
Sources and methodology
FDA statistical guidance for diagnostic-test studies and FDA explanatory material on predictive values were checked October 18, 2026. Every population, test characteristic, and result in the worked examples is invented for calculation. No real condition's prevalence or test performance is asserted.
- FDA: Diagnostic-test statistical reporting — checked October 18, 2026.
- FDA: Predictive-value explanation — checked October 18, 2026.
Continue with Absolute versus relative risk and Age-adjusted versus crude rates for related context.
To retain baseline risk and the method used to identify cases, see Absolute vs Relative Risk: Put Health Headlines in Context and Reported and Measured Health Data: Compare the Method Before the Percentage.