
A headline says a risk was cut in half. That sounds substantial, but it does not say how common the outcome was initially. The absolute numbers and time period are essential to understanding what the claim means. Relative and absolute measures belong together.
At a glance
- Relative change depends on the starting risk.
- Absolute difference shows the change in event probability.
- Use the same outcome, population, and follow-up period.
Ask for the baseline
WHO’s epidemiology resources distinguish comparisons of risk and disease occurrence. For reading a headline, the first practical step is to find the actual event numbers and denominators. “Half the risk” could describe a change from 20% to 10% or from 0.2% to 0.1%.
Both represent a 50% relative reduction. The absolute reductions are 10 percentage points and 0.1 percentage points, respectively. The relative figure is not false, but it answers only part of the reader’s question.
A fictional trial example
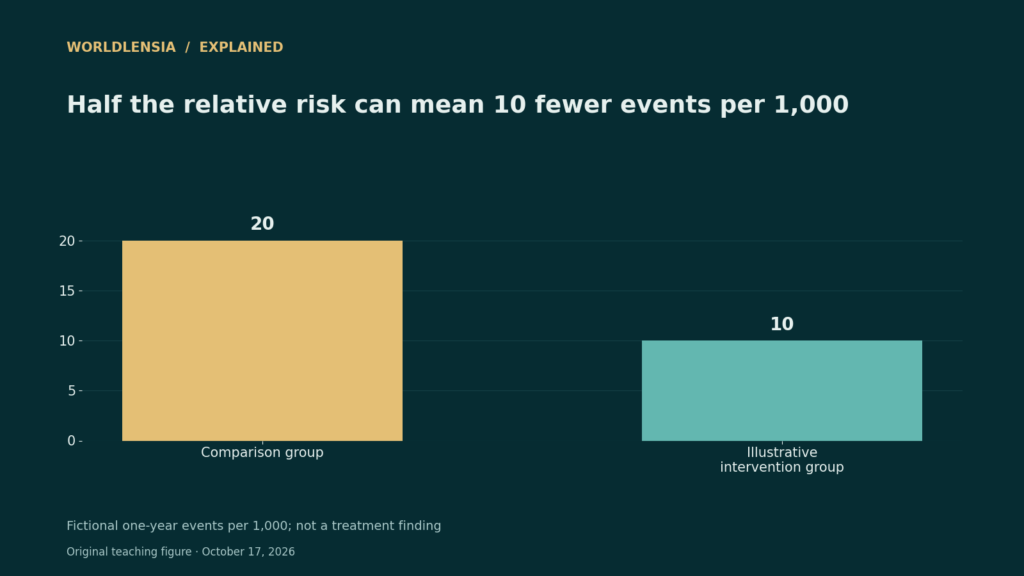
Suppose 20 of 1,000 people in one group experience an outcome over a defined year, compared with 10 of 1,000 in another group. Risks are 2% and 1%. The absolute reduction is one percentage point, and the relative reduction is 50%.
In this simplified illustration, the reciprocal of the absolute difference is 100 people over that year for one fewer event, assuming the comparison can validly be interpreted as an intervention effect. Real studies need uncertainty estimates, suitable design, and careful interpretation. This is arithmetic, not evidence that any named treatment works.
Read the study before applying it
Check whether the result is an association or an estimate from a randomized comparison. Ask which population was studied, how outcomes were defined, how long follow-up lasted, and what uncertainty surrounds the estimate. Benefits and harms may involve different outcomes and time horizons.
Do not apply an average study result as a personal prediction. Individual circumstances and clinical decisions require relevant professional guidance. A good explanatory headline should make the baseline and time period easier to find, rather than hiding them behind the largest relative percentage.
A practical comparison
| Fictional one-year comparison | Group A | Group B |
|---|---|---|
| People | 1,000 | 1,000 |
| Events | 20 | 10 |
| Risk | 2% | 1% |
| Difference | 1 percentage point absolute | 50% relative reduction |
Before using the result
- Find the event counts and denominators.
- Record the follow-up period.
- Distinguish association, causation, and personal prediction.
Continue exploring: more health-statistics guides.
Sources and methodology
Reviewed October 17, 2026. WorldLensia explanatory analysis. Worked examples and the accompanying teaching figure are illustrative, not measured findings or product tests. Consult the linked source for definitions and revisions.
To keep test interpretation and case definitions separate from a relative-risk headline, see Sensitivity, Specificity and Predictive Value: Read a Test Result Without Reversing the Probability and Incidence and Prevalence: New Cases and Existing Cases Are Different.