
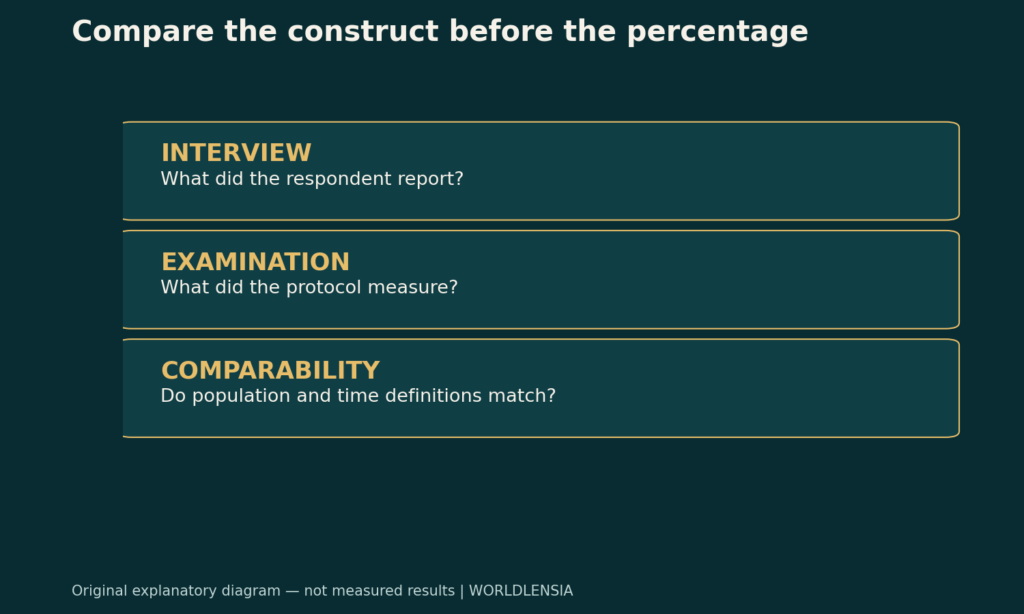
Health data can describe the same broad subject while measuring different things. One statistic may record a self-reported diagnosis; another may come from an examination or laboratory measure under a defined protocol. The percentages are not automatically interchangeable because the topic label looks similar.
Before comparing the numbers, identify the construct, the collection method, the population and the reference period. A disagreement can be informative, but it does not identify which number is the “true” one without a clearer account of what each was designed to measure.
Health data: Begin with the question asked
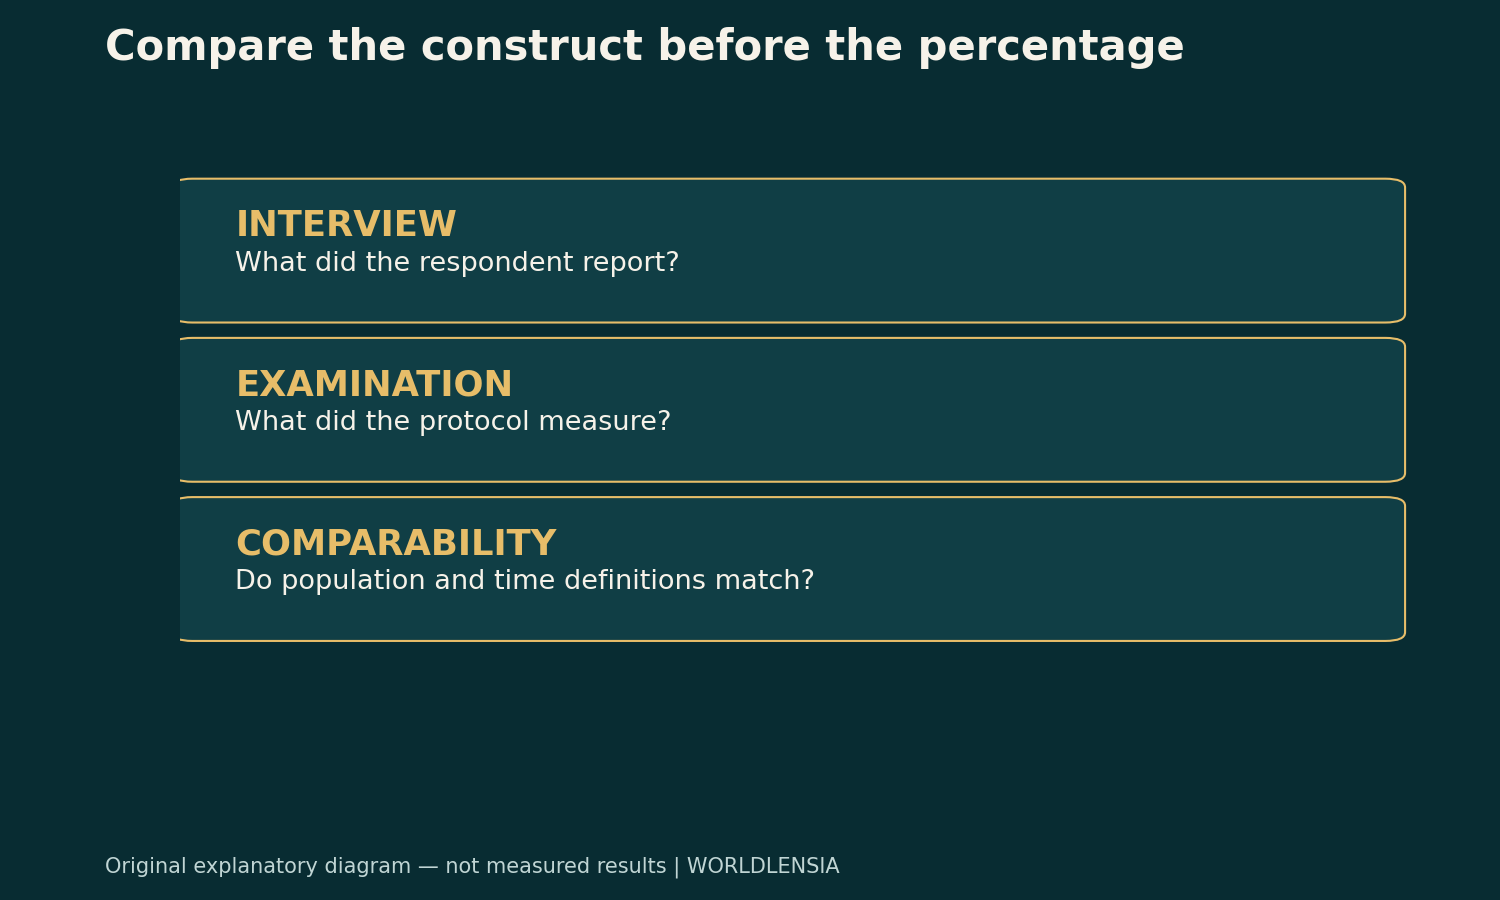
“How many people report having been diagnosed?” is a different question from “How many people meet a measurement definition during an examination?” Both can be useful. Their interpretation depends on the source protocol and the intended analytical question.
Do not choose the definition only after seeing which percentage is larger. Decide whether the article concerns reported experience, access to diagnosis, a measured characteristic or another construct. Then select evidence that actually answers that question.
A broad heading such as “health status” is not enough. Record the exact question or measurement definition and explain any shortened label used in the article.
Two survey programs illustrate the method distinction
CDC's National Center for Health Statistics describes NHIS as collecting health information through personal interviews. It describes NHANES as combining interviews with health examinations and laboratory information.
Those program-level descriptions help establish that their methods differ. They do not establish that every variable in one program is self-reported or that every variable in the other is physically measured. Inspect the documentation for the particular indicator and cycle.
This article uses the programs as examples of method literacy. It does not compare current prevalence estimates or claim that two named indicators are directly compatible.
Build a construct-to-measure table
Imagine an analyst considering two hypothetical indicators. Indicator A asks whether a respondent has previously been told they have a condition. Indicator B records whether a research measurement meets a specified study definition at the examination.
| Hypothetical field | Indicator A | Indicator B |
|---|---|---|
| Construct | Reported prior diagnosis | Measurement-based status at examination |
| Data collection | Interview response | Defined examination protocol |
| Time meaning | Depends on question wording | Depends on examination and reference rule |
| Needed documentation | Question, respondent, coding | Instrument, protocol, classification rule |
The table does not supply a clinical threshold or imply that either indicator is inherently superior. It shows which documentation must be inspected before the numbers can be compared.
Question wording changes the numerator
An interview can ask about the present, a recent interval or any time in a person's life. It may ask about a diagnosis, symptoms, treatment or limitations. These questions can all relate to a condition while producing different case definitions.
Preserve the reference period. A lifetime diagnosis question should not be relabeled as current disease prevalence. A recent symptom report should not automatically be presented as a confirmed diagnosis.
Check who answers. A person describing their own experience is not the same data-collection arrangement as one household member reporting for others. The method does not make the response useless, but it belongs in the interpretation.
Measurement protocols also need context
A measured variable depends on the instrument, procedure, timing and classification rule. An examination is not an escape from all measurement limitations. Read how the protocol was standardized and what exclusions apply.
Do not create a new clinical cutoff for the article. If a research indicator uses a threshold, cite the relevant protocol and explain what that threshold defines. A public-data classification is not a personalized diagnosis for a reader.
Repeated measurements, missing tests or incomplete examinations can also affect which participants contribute to an estimate. Check the analytic sample and weights for the selected variable rather than assuming every survey participant has every measurement.
Population coverage can differ
Two estimates may cover different ages, living arrangements or other populations. A percentage for adults cannot be compared casually with one for all ages. A household-based target population may not represent every institutional setting.
Keep eligibility and exclusions beside the estimate. If an analysis uses only participants with a complete examination, explain that subset and the appropriate method. Do not silently change the denominator to make the comparison easier.
The ACS margins-of-error guide provides a related lesson about keeping uncertainty attached to survey estimates. Health surveys have their own designs and documentation, so use the applicable methods rather than copying an ACS formula without justification.
A difference is not automatically a reporting error
Suppose a verified analysis finds that reported diagnosis and a measurement-based indicator differ in the same population. That could motivate questions about definitions, awareness, treatment, timing or collection error. It does not, on its own, prove one specific explanation.
Avoid saying that respondents lied or that a survey failed merely because the values differ. Those are claims about a mechanism and need evidence. A construct difference may explain some of the gap even when both measurements were collected as designed.
Conversely, do not dismiss a discrepancy as “just methods” without investigating. The method difference is the starting point for a better question, not a universal explanation that makes every inconsistency unimportant.

Match time windows before comparing trends
An interview period, examination cycle and publication date are separate pieces of time information. A report released in one year may describe data collected earlier. A multi-year estimate can overlap another estimate's collection window.
Label the observation period, not only the release year. If a source changes a question or protocol between cycles, read the comparability note before describing the difference as a population trend.
Do not use a new release date to imply that the underlying observations were collected recently. That is especially important when readers might treat the number as a current risk assessment.
Keep detection and underlying occurrence separate
A reported diagnosis depends on more than the existence of a condition; it also depends on what the question asks and what has been recognized or communicated. A measurement-based indicator has its own protocol and classification boundary.
Those facts can help frame hypotheses, but this article does not quantify their effects. A claim that a gap measures undiagnosed illness requires a compatible study design and definitions, not simply subtraction of two unrelated percentages.
Likewise, one indicator's sensitivity or specificity cannot be assumed from its name. The diagnostic-test guide explains why test-performance probabilities need their own evidence and populations.
Do not merge incompatible percentages
Averaging two estimates with different constructs does not automatically produce a better estimate. It can create a number with no clear interpretation. Weighting by sample size alone does not repair a mismatch in what is being measured.
If a synthesis is appropriate, use a documented method and explain its target. Otherwise, present the estimates separately with their definitions and limitations. A transparent comparison table is often more useful than a forced single headline figure.
The vaccination-coverage guide illustrates a related need to check doses, age groups and data sources. The lesson is not that every source should agree, but that a comparison must preserve the meaning of each numerator and denominator.
A practical pre-publication record
For each estimate, record the exact variable, question or measurement protocol, case definition, target population, analytic sample, weighting basis, observation period, release date and uncertainty measure. Add the source table and any comparability warning.
Then write a one-sentence answer to “What does this percentage describe?” If the sentences differ materially, explain the difference before comparing the numbers. If a key definition is missing, leave the comparison unresolved rather than inventing compatibility.
For this article, the supported conclusion is methodological: reported and measured health indicators can answer different questions. Establishing an empirical gap, its size and its cause requires a separate, properly documented analysis.
Sample weights belong to the selected measure
Complex surveys can provide different weights for interview and examination components or particular analytic samples. Use the documentation for the variable and cycle being analyzed. A weight appropriate for one subset should not be copied to another merely because both belong to the same program.
This article does not calculate survey estimates. It identifies a necessary check before such a calculation. For an empirical comparison, retain the exact weighting and variance method, and obtain appropriate statistical review when the design requires expertise beyond a simple proportion.
A method comparison can be useful without a prevalence headline
An article can explain why two indicators are not directly comparable without inventing a numerical gap. A clear table of questions, protocols, populations and time windows may answer the reader's immediate problem more honestly than an unsupported chart.
If compatible estimates later become available, add them with their source dates and uncertainty. Keep the earlier methodological explanation intact where it remains correct, and identify the new evidence as an update rather than pretending it was already checked.
Avoid treating measured as synonymous with perfect
An examination can reduce some forms of reporting uncertainty while introducing its own protocol, instrument and participation questions. An interview can capture experiences that a one-time measurement does not. The usefulness of each depends on the construct being studied.
Choose evidence for the question, not from a hierarchy based only on whether a number came from a device or a response. A defensible comparison explains the strengths and limitations of the actual measures rather than declaring one entire collection method infallible.
Keep claims attached to the protocol
A comparison is easier to review when each percentage links to its exact variable documentation. A general survey homepage provides context but does not replace the indicator's definition.
Sources and methodology
Program methods were checked against CDC/NCHS's About NHIS and About NHANES on October 19, 2026. The NHANES page displays December 18, 2024; a publication/update date for the NHIS page was not established in this review. The indicator table and analytical checklist are original explanatory work. No prevalence estimate, clinical cutoff or personal medical recommendation is supplied.
To separate case definitions from reporting delays, see Incidence and Prevalence: New Cases and Existing Cases Are Different and Provisional Death Data: Compare Reporting Maturity Before Calling a Trend.