

A vaccination-coverage percentage is incomplete without the vaccine or antigen, dose number, eligible group, and reference period. Coverage for a first dose and coverage for a later dose answer different questions. A national average can also hide substantial differences between districts.
WHO and UNICEF publish national immunization-coverage estimates using multiple information sources. WHO explains that administrative data involve reported vaccinations and a target-population denominator, while survey and other evidence can contribute to estimates. Those source types should not be treated as automatically identical measurements.
Start with a defined fraction
Suppose a fictional district reports 900 eligible children receiving a specified dose out of a target group of 1,000. Coverage is 90%. If the true eligible population is 1,100 instead, the same 900 vaccinations imply about 81.8%.
| Assumed eligible population | Vaccinated children | Calculated coverage |
|---|---|---|
| 1,000 | 900 | 90.0% |
| 1,100 | 900 | 81.8% |
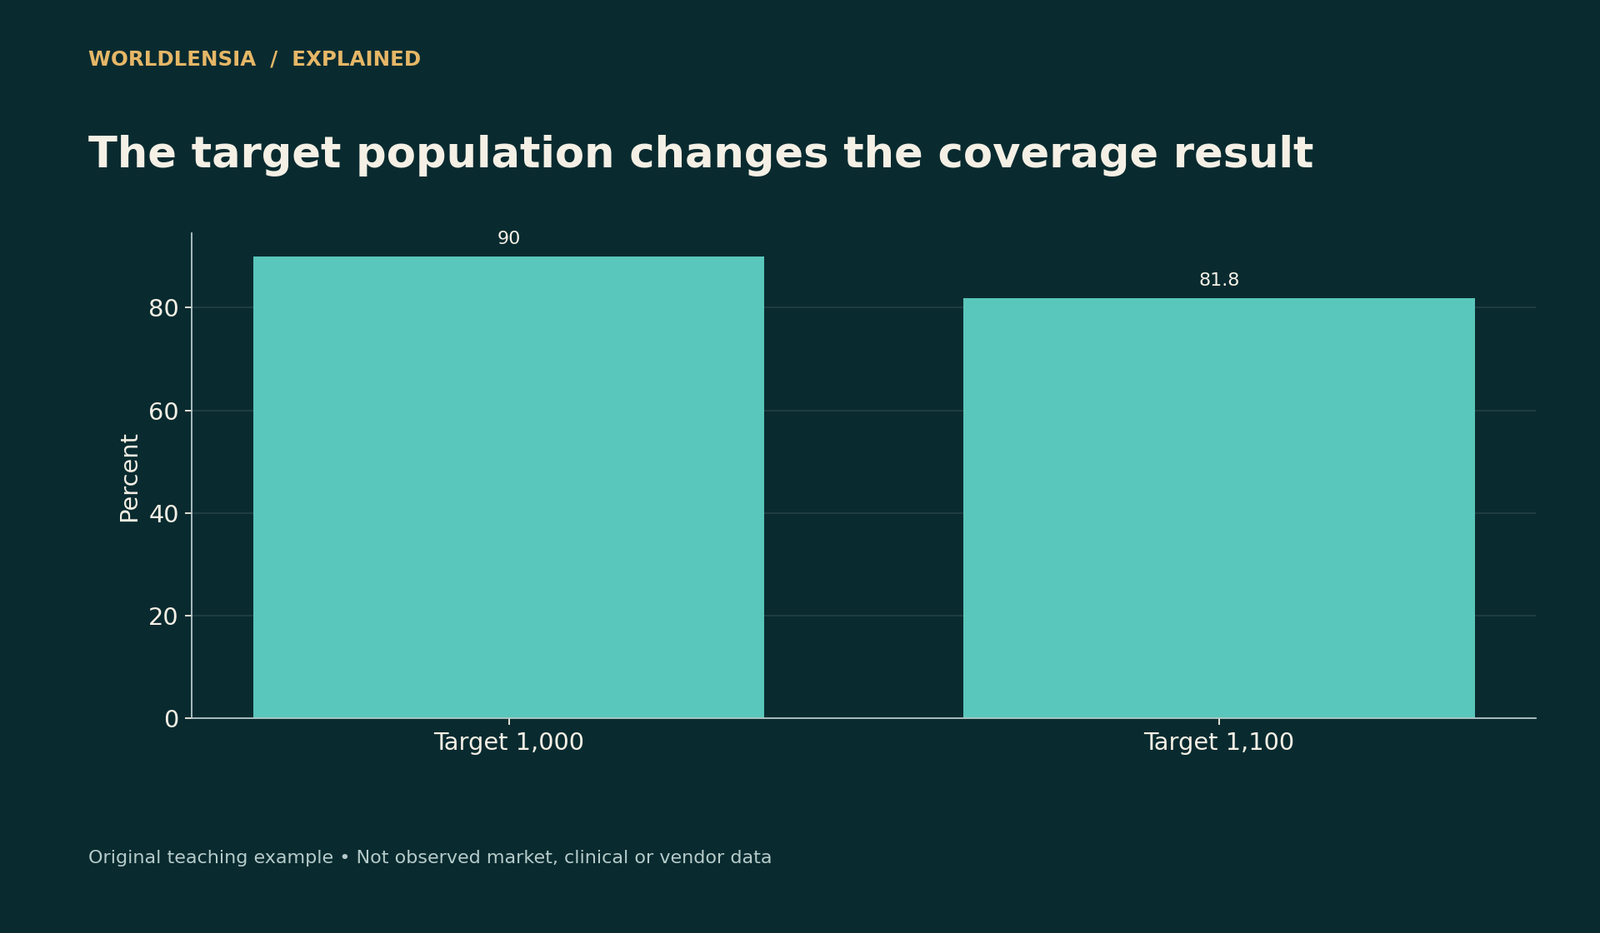
Figure data and assumptions
Original hypothetical teaching data; see the caption and article for assumptions.
| Category | Coverage |
|---|---|
| Target 1,000 | 90.0 |
| Target 1,100 | 81.81818181818183 |
The chart varies only the denominator. These numbers are invented to illustrate a data-quality issue, not to estimate coverage in any real place or suggest that a particular country's reports are unreliable.
Doses and people are not always interchangeable
A service total may count doses administered, while a coverage measure needs people receiving a particular dose under a defined schedule. Multiple doses, catch-up activity, records from outside the area, and duplicate reporting can complicate interpretation.
Do not divide an undifferentiated count of all doses by the number of children and call it coverage for one vaccine. Read the indicator's metadata and schedule. A clearly labeled measure can still be misused if its numerator is replaced with a convenient but incompatible total.
Age and timing matter
Coverage by a recommended age differs from receipt at any later time. A person vaccinated after the relevant age can affect a catch-up measure differently from an on-time measure. Compare the same definition across populations.
The data year is also separate from the publication year. A release this year can describe vaccinations in the previous year. Historical estimates can be revised when new information becomes available, so record the release vintage used in a comparison.
Administrative and survey sources have different limits
Administrative systems depend on complete reporting and a suitable population estimate. Surveys depend on their sampling and measurement methods, including how vaccination history is established. Neither should be presented as perfect by default.
WHO/UNICEF estimates draw on an assessment of available evidence rather than merely copying one administrative percentage. When reporting their estimates, use the named estimate series and metadata rather than attaching the same label to an unrelated national total.
A national average can hide local gaps
Imagine two fictional districts with equal eligible populations. One has 98% coverage and the other 72%. Their combined rate is 85%, but neither district actually has that rate. The national-style summary conceals the distribution.
If district populations differ, weight by the relevant eligible population. A simple average of district percentages gives equal influence to a small and a large district. Use the appropriate counts before dividing when those counts are available and compatible.
Coverage is not a complete protection measure
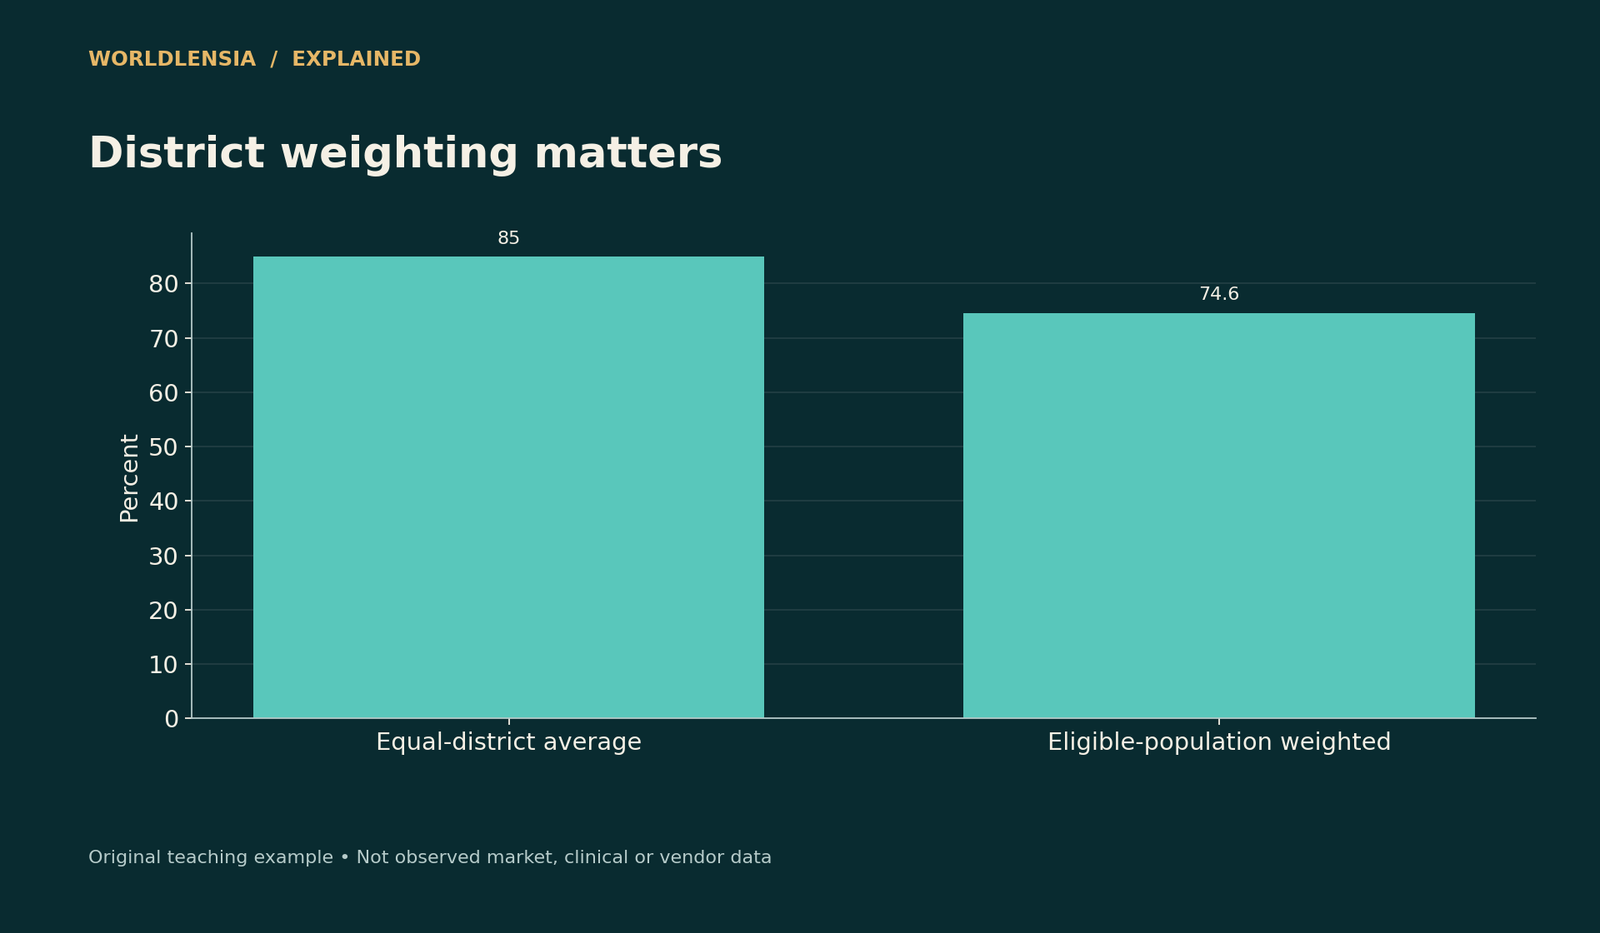
Figure data and assumptions
Original hypothetical teaching data; see the caption and article for assumptions.
| Category | Coverage |
|---|---|
| Equal-district average | 85.0 |
| Eligible-population weighted | 74.6 |
A coverage figure records receipt under a definition; it does not by itself quantify every person's immunity, disease risk, or the effectiveness of a program. Different vaccines, schedules, and contexts require their own medical and public-health interpretation.
Avoid using this arithmetic guide to recommend individual vaccination decisions. Readers should use qualified health guidance and the applicable local schedule for personal questions. The article's purpose is to improve interpretation of public data.
Compare first and later doses carefully
A gap between first-dose and later-dose coverage can prompt investigation into access and completion, but the rates may not track exactly the same individuals or cohorts. Do not label the difference a precise individual dropout probability without checking the indicator method.
Supply, outreach, reporting, migration, timing, and other factors may contribute. A chart can identify a question; it does not prove the cause. Use local evidence before attributing a change to one program decision.
A weighted example shows why counts help
Suppose District A has 100 eligible children with 98 vaccinated, while District B has 900 with 648 vaccinated. Their coverage rates are 98% and 72%. The simple average is 85%, but the combined count is 746 vaccinated out of 1,000 eligible, or 74.6%.
The larger district supplies most of the eligible population, so its rate has more influence on the combined result. Reporting the simple average as national-style coverage would answer the wrong weighting question. These are fictional counts, and the calculation assumes compatible definitions and no duplication across districts.
Make revisions visible
If a target-population estimate is updated, a coverage rate can change even when the reported number vaccinated is unchanged. A revised historical series may therefore differ from an earlier publication. Preserve both the data year and release date when documenting a comparison.
Do not describe every revision as evidence of misconduct or a sudden program change. Investigate what changed: numerator reporting, population estimates, survey evidence, methods, or corrections. A responsible explanation separates a statistical revision from an actual change in service delivery.
Keep a chart's conclusion within its scope
A chart comparing coverage should use the same vaccine-dose indicator and compatible age definition. Label any methodological or series break. Do not join incompatible observations with a smooth line that suggests a continuous measured trend.
If the source provides uncertainty or data-quality notes, retain them in the article. If it does not, avoid inventing an interval or describing every printed decimal as precise. A clear visual is valuable only when its caption makes the measurement understandable and its limitations visible to a reader seeing it outside the full article.
A reporting checklist
Record vaccine or antigen, dose, eligible age group, geography, data period, source type, denominator method, and revision vintage. Show subnational variation where the story concerns access. Keep estimates, administrative reports, and survey results clearly labeled.
WorldLensia's age-adjusted-rate guide addresses another reason health comparisons need compatible populations. The shared principle is simple: a percentage becomes interpretable only when the reader knows exactly who and what was counted.
Keep access conclusions evidence-based
A lower coverage figure can motivate questions about service access, reporting, and eligibility, but it does not identify the cause by itself. Investigate suitable local evidence before attributing the difference to public attitudes, program quality, supply, or any one group. Avoid treating a national average as a description of every community. A useful article can show the gap and explain what further evidence would help, while keeping individual health decisions separate from the statistical comparison. That restraint strengthens the analysis rather than weakening its practical value.
Sources and methodology
WHO/UNICEF's coverage-estimate explanation, WHO administrative-method guidance, and indicator metadata were checked October 18, 2026. All district counts and percentages in the examples are original teaching scenarios, not actual vaccination statistics.
- WHO/UNICEF: Coverage-estimate methods — checked October 18, 2026.
- WHO: Administrative coverage method — checked October 18, 2026.
Continue with Match health population definitions and Read absolute and relative risk for related context.
To check age composition and population coverage before comparing percentages, see Age-Adjusted vs Crude Health Rates: Compare Populations Fairly and Why a High Survey Response Rate Does Not Prove Full Coverage.