
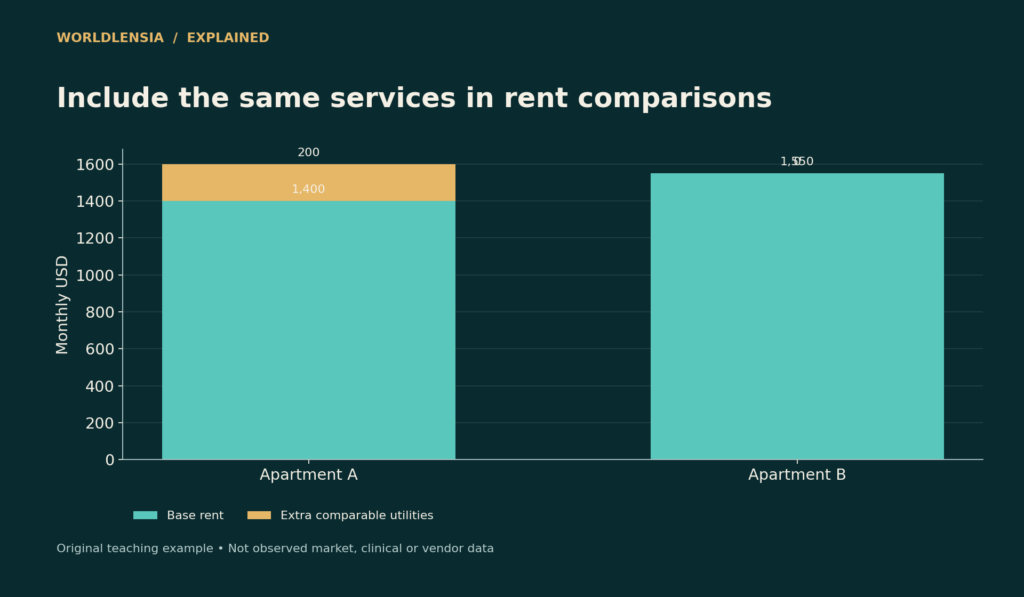
A city's advertised rent can differ from the rent paid by its existing tenants. It can also exclude utilities that another source includes. A fair comparison begins by identifying what each number measures before ranking cities or calculating affordability.
Census housing materials distinguish contract rent from gross rent. Gross rent includes specified utility and fuel costs in addition to contract rent. Listing data generally describe available properties under the provider's coverage, while a household survey can describe occupied rental housing. Those are different populations.
Compare the total consistently
Take two fictional apartments. Apartment A advertises $1,400 a month, with $200 of utilities paid separately. Apartment B costs $1,550 and includes the same utilities. The comparable monthly amounts are $1,600 and $1,550. Ranking only the advertised base payment would reverse their order.
| Apartment | Stated rent | Additional comparable utilities | Combined amount |
|---|---|---|---|
| A | $1,400 | $200 | $1,600 |
| B | $1,550 | $0 | $1,550 |
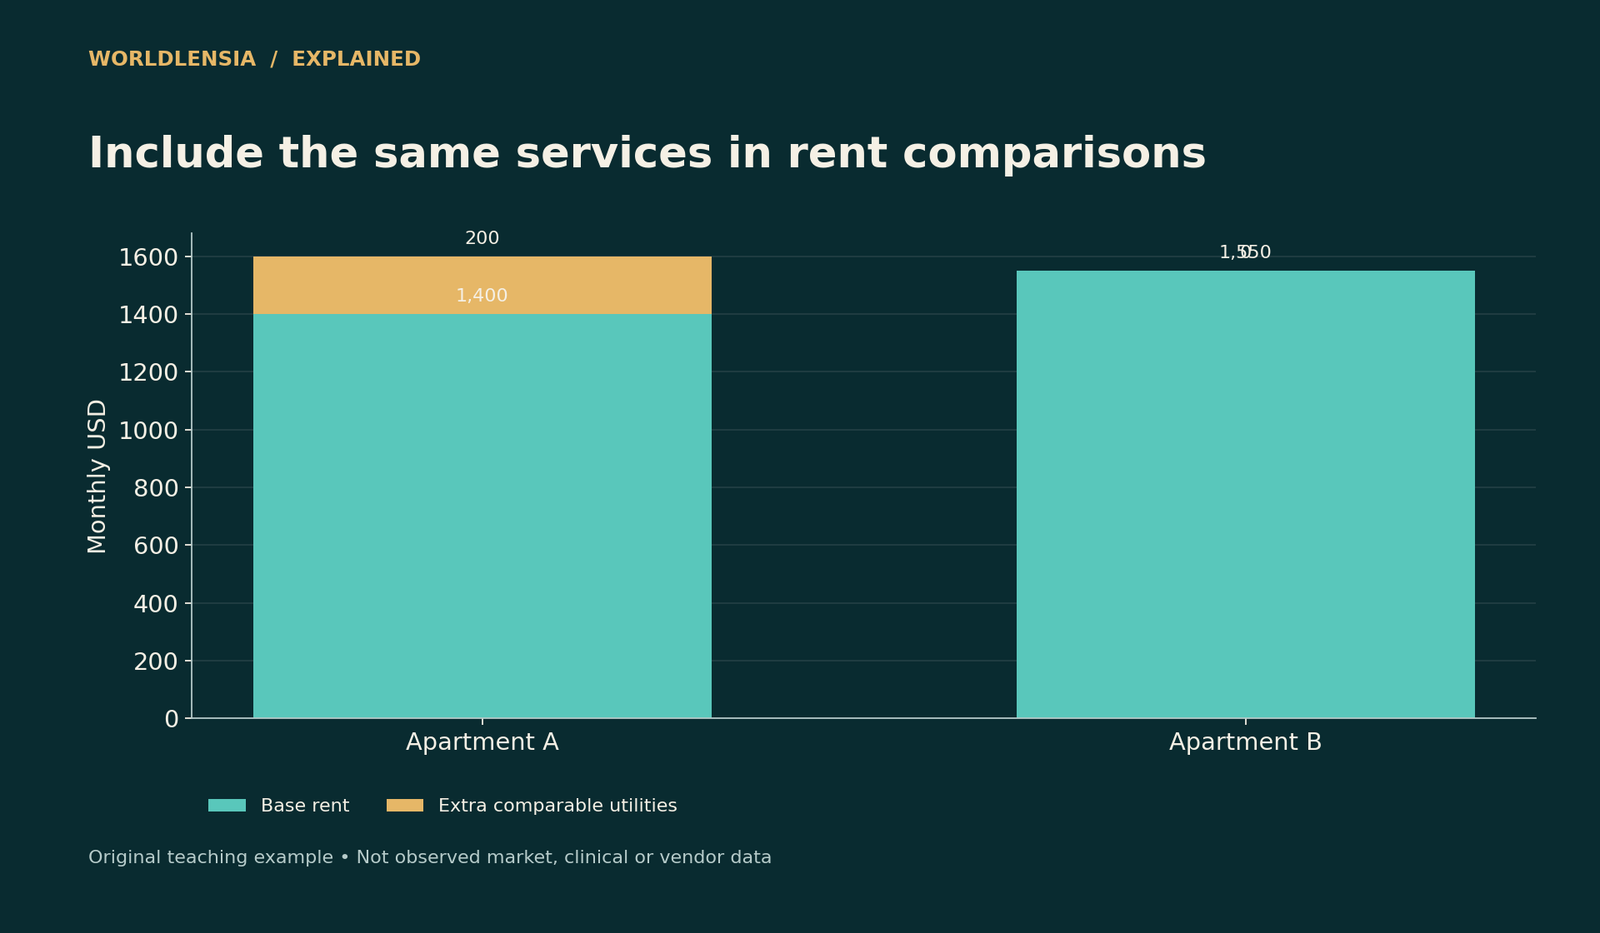
Figure data and assumptions
Original hypothetical teaching data; see the caption and article for assumptions.
| Category | Base rent | Extra comparable utilities |
|---|---|---|
| Apartment A | 1400.0 | 200.0 |
| Apartment B | 1550.0 | 0.0 |
This example is not an official gross-rent calculation or a current listing. It shows why included services must be checked. Parking, internet, pet fees, deposits, and other charges can require separate treatment depending on the comparison's purpose.
Existing tenants and new movers face different markets
A survey of occupied units includes people who have lived in their homes for varying periods. New listings describe opportunities available at the time of collection. Differences can reflect lease timing, unit mix, location, and selection, not simply a source error.
For a person moving next month, an up-to-date listing sample may be relevant. For studying the housing costs of all current renter households, an occupied-unit survey may be more appropriate. Name the population instead of using “rent” as if it were one universal measure.
Match unit characteristics
Compare bedroom counts, property types, locations, and included amenities where feasible. A city with many small apartments can have a lower median monthly rent than one dominated by larger homes, even if comparable units cost more.
Rent per square foot can provide another view, but it does not resolve every difference. A small unit may have a higher cost per square foot while requiring a lower monthly payment. The decision determines which comparison helps.
A median is not a price index
If expensive units enter a listing sample, its median can rise even when the price of every previously observed unit stays unchanged. Conversely, a change in the mix toward smaller units can lower the median without making comparable housing cheaper.
A repeat-unit or quality-adjusted index attempts to answer a different question from the median of observed units. Read the provider's methodology and do not describe the two as interchangeable. WorldLensia's mean-versus-median income guide explains the general role of distribution summaries.
Affordability needs an income denominator
Dividing a city's median rent by its median household income is not generally the median rent burden of its renters. Those medians may describe different populations, and the ratio of medians is not the median of household-level ratios.
Use a defined rent-burden measure where available. If making an illustrative budget, identify the assumed income, utilities, taxes, household needs, and time period. Do not present one hypothetical renter as representative of the entire city.

Figure data and assumptions
Original hypothetical teaching data; see the caption and article for assumptions.
| Category | Rent |
|---|---|
| Contract monthly | 1800.0 |
| Annual cost / 12 | 1650.0 |
Respect the data window
An ACS multi-year estimate combines information across a period. A single week's listing snapshot reflects a much narrower market moment. Comparing them without discussing timing can exaggerate a supposed discrepancy.
Also check processing and methodology notes. Census has published notes on changes to contract-rent processing. Those notes matter when a trend crosses a change in how values are handled. Preserve a record of the table and release used.
Discounts and concessions can change the effective amount
A listing offering one month free on a 12-month lease at $1,800 per month has $19,800 of base rent across the year, or $1,650 per month when spread evenly. That effective amount differs from the ongoing contractual monthly payment and from what renewal may cost. Additional fees can change the comparison again.
State whether a published figure is advertised, contracted, or adjusted for concessions. A household still needs to know when payments are due. An evenly spread effective figure can be useful for comparison while concealing a cash-flow pattern that matters to the tenant.
Avoid mixing currencies and local cost concepts
For international comparisons, a market-exchange-rate conversion answers what a currency amount becomes at that rate. It does not automatically describe local affordability or purchasing power. Pair rents with relevant local incomes and consistent included charges when those are the subject.
Keep the exchange-rate date or method in the research record. A rent ranking expressed in a foreign currency can change because exchange rates moved, even if local rents stayed constant. Do not attribute that entire movement to landlords or housing supply.
Keep source coverage visible
A property platform may omit informal rentals, small landlords, or units listed elsewhere. A survey may cover a wider population but arrive later and carry sampling uncertainty. Neither limitation disappears because a dashboard displays a clean citywide number.
For a real comparison, explain how many observations support a listing statistic and whether the sample changed materially. If the provider does not disclose enough method information, qualify the conclusion rather than inventing confidence. A source can be useful for describing its own coverage without being representative of every renter.
Make the article's promise match that coverage. “Advertised rents in this platform's sample” is narrower and more defensible than a claim about exactly what every new tenant will pay.
Create a comparison readers can use
For each source, record coverage, period, geography, unit types, definition, included charges, statistic, and uncertainty. Then build a table with genuinely comparable amounts. If they cannot be harmonized, describe the differences rather than forcing a single ranking.
Readers gain more from knowing what a rent figure covers than from a precise-looking list that mixes incompatible measures. Pair the number with the actual housing question: existing renter costs, new-mover choices, market trends, or household affordability.
Separate deposits from recurring rent
A refundable security deposit affects the cash needed to move but is not automatically a recurring monthly housing cost. A nonrefundable fee has a different treatment. If spreading upfront expenses over a planned stay, state that convention and the assumed duration. The same fee produces a different monthly equivalent over one year and five years. Readers comparing affordability need both the upfront cash requirement and the recurring payment. Combining them into a single number without explanation can hide a practical barrier even when the average looks manageable.
Sources and methodology
Census gross-rent definitions and the 2025 contract-rent processing note were checked October 18, 2026. The apartment amounts and all affordability examples are original illustrations, not city price estimates.
- Census: Gross rent definition — checked October 18, 2026.
- Census: Contract-rent processing change — checked October 18, 2026.
Continue with House prices versus affordability and Uncertainty in city comparisons for related context.
To compare the rent definition with vacancy and ownership costs, see Rental and Homeowner Vacancy Rates Use Different Inventories and Rent vs Buy: Compare Cash, Equity and Risk on the Same Timeline.