
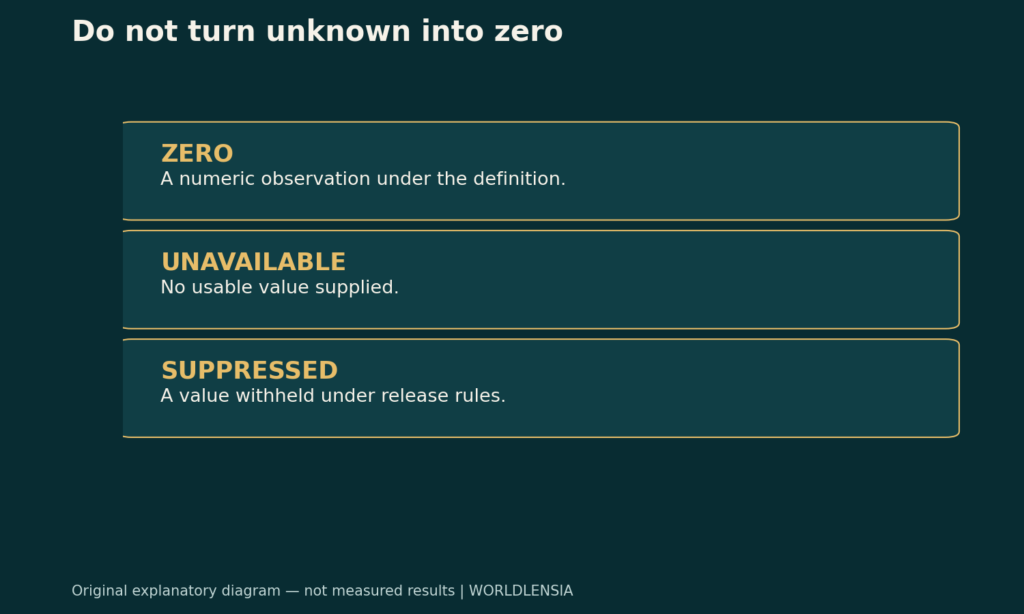
Missing data in a public dataset does not mean nothing happened. A blank cell may indicate that the value was not collected, could not be estimated, was withheld or was inapplicable. Replacing every nonnumeric entry with zero can turn incomplete evidence into a confident but false comparison.
Before adding totals or drawing a chart, preserve what the source says about each cell. A measured zero is a number. A missing observation is an absence of a usable number. A suppression flag indicates that the publisher has withheld a value under its release rules.

Begin with the release-specific legend
The Census Bureau's ACS release guidance explains that some tables and estimates are suppressed or unavailable. That establishes a reason to inspect the documentation; it does not give one universal meaning to every symbol in every government spreadsheet.
Read the legend for the exact dataset and release year. Record how it represents zero, not applicable, unavailable, suppressed, estimates below a reporting threshold and other special states. A dash or letter can mean different things in different series. A numeric-looking code can also be a sentinel rather than an observation.
Keep the original cell in a raw-value field. Create a separate status field before producing a cleaned numeric field. This makes the transformation reviewable and prevents later users from mistaking a cleaning decision for a source measurement.
Five fictional districts
Imagine a teaching dataset containing a count for five districts. The entries are 8, 12, 0, unavailable and suppressed. The first three cells contain numeric observations. The last two do not supply usable numbers for the calculation.
| Fictional district | Source entry | Interpretation for this example |
|---|---|---|
| North | 8 | Numeric observation |
| South | 12 | Numeric observation |
| East | 0 | Observed zero |
| West | Unavailable | No value supplied |
| Central | Suppressed | Value withheld |
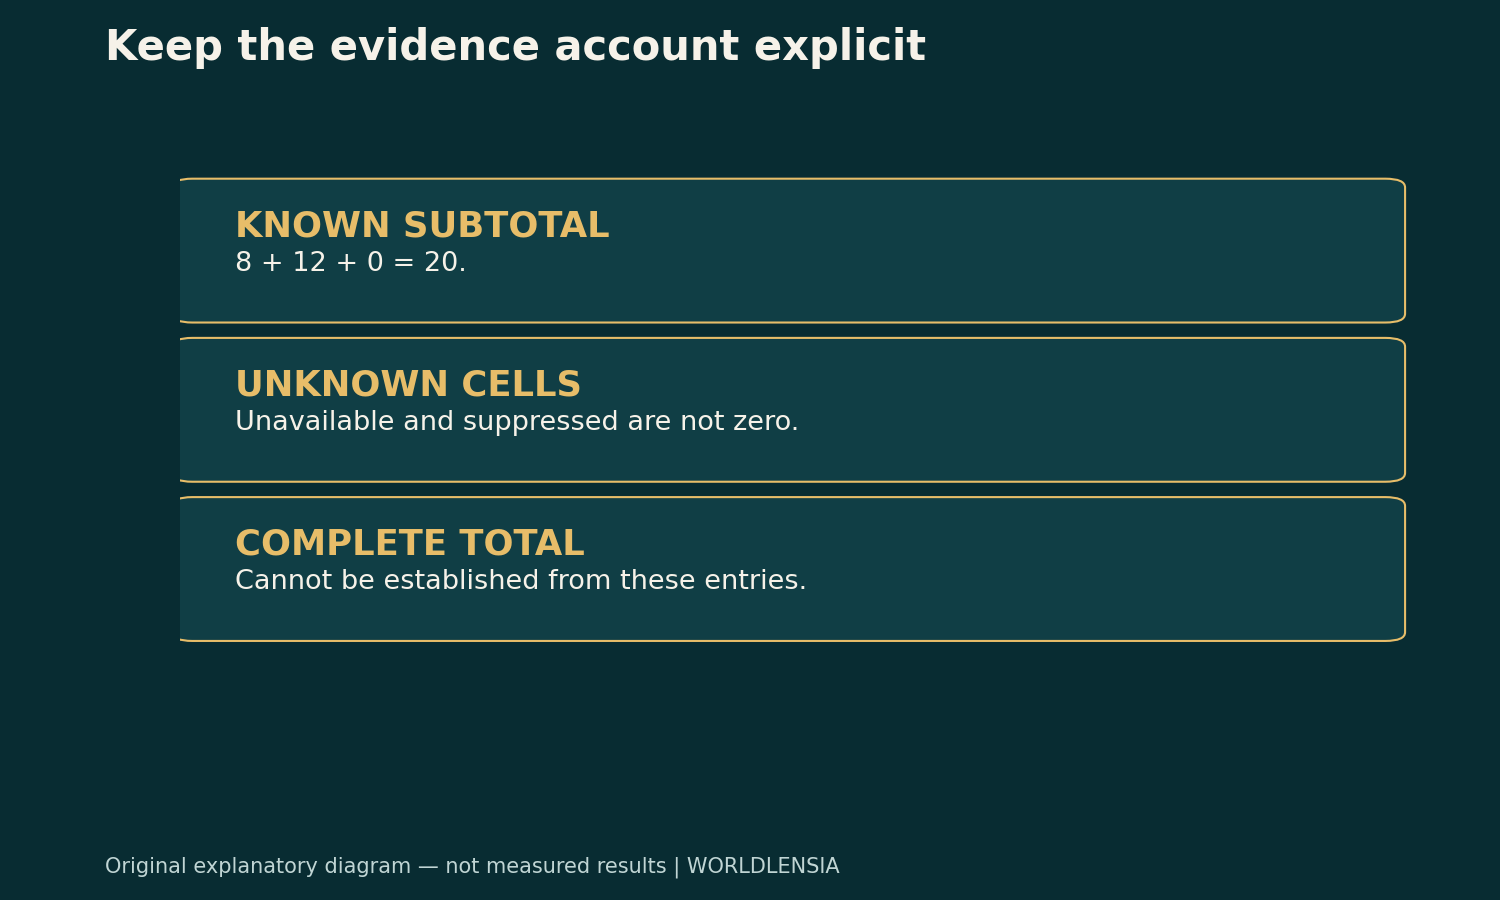
The observed numeric subtotal is 8+12+0=20. The complete five-district total is unknown from these entries. Calling 20 the overall total would imply that the two unknown contributions are zero. The table does not support that implication.
For the three available numbers, the mean is about 6.67. This is a mean for the observed subset, not necessarily a fair estimate for all five districts. If you replace both nonnumeric entries with zero, the five-row mean becomes 4. The lower result comes from an unsupported assumption, not additional evidence.
Make the chart preserve uncertainty
A zero-height bar can communicate a real zero. It is a poor substitute for an unavailable value because many readers will interpret the bar as a measured outcome. Show a clearly labeled gap, a distinct missing-data symbol or an accompanying table instead.
Explain the treatment in the caption. “Three districts have numeric observations; two values are unavailable or suppressed” is more informative than hiding the omissions in a footnote labeled “data cleaned.” Keep a complete list of included and excluded units when the omission affects a ranking.
Do not connect a line through a missing period without explaining the interpolation. A straight line suggests a modeled path between observations; it is not a measurement of the missing period. Whether interpolation is appropriate depends on the question and the series, not the charting software's default.
Suppression is not an invitation to reconstruct a cell
Some values are withheld to protect confidentiality or satisfy release-quality rules. Do not assume the reason without reading the publisher's explanation. Do not try to reverse-engineer protected values from nearby totals and then present them as published observations.
If the source offers an approved aggregate or another public measure that answers the question, use it with its own definition. If not, state the limit. A narrower claim supported by available data is stronger than a complete-looking table built from guesses.
Missing data and sampling error are separate checks
An available estimate can still be uncertain. A suppressed estimate is not simply an estimate with a margin of error you can ignore. Check both availability and statistical uncertainty before comparing places.
The ACS margins-of-error guide explains the second check. A source ledger can record the first: which cells were missing, what the source legend said and how the analysis handled them.
Before publishing, verify that the numeric total is labeled as a subtotal when needed, the denominator matches the observed coverage, and every chart preserves nonnumeric states. A short explanation of what is unknown makes the result easier to trust and harder to misuse.
Sources and methodology
The availability distinction was checked against the Census Bureau's ACS Data Release Rules on October 19, 2026. Its publication/update date was not established in the retrieved text. The districts, counts, cleaning example and chart recommendations are original explanatory work, not real district statistics.
To separate unavailable observations from coverage and imputation, see Why a High Survey Response Rate Does Not Prove Full Coverage and Missing Values in AI Data: Imputation Changes the Evidence.