
Transit ridership statistics do not all count the same thing: a boarding count does not usually represent the number of different people using the system. A rider who transfers between vehicles can create more than one boarding during a single journey, and the same person can make several journeys in a day.
This matters when comparing cities, interpreting a ridership increase or estimating how many residents a service reaches. The unit in the denominator can change the story even when the underlying journeys remain similar.
Identify the measure behind “ridership”
The Federal Transit Administration’s National Transit Database glossary defines measures including unlinked passenger trips and passenger miles traveled. [1] FHWA’s explanation notes that a transfer to another vehicle or route counts as another unlinked trip. [2]
An unlinked trip is therefore a boarding-based measure. A linked journey concerns a connected origin-to-destination trip, potentially involving transfers. Unique riders require a way to distinguish people, with the associated measurement and privacy considerations.
These concepts should not be substituted for one another. A dataset can be accurate for boardings while being unable to answer how many different residents used transit that month.
Follow a fictional commute
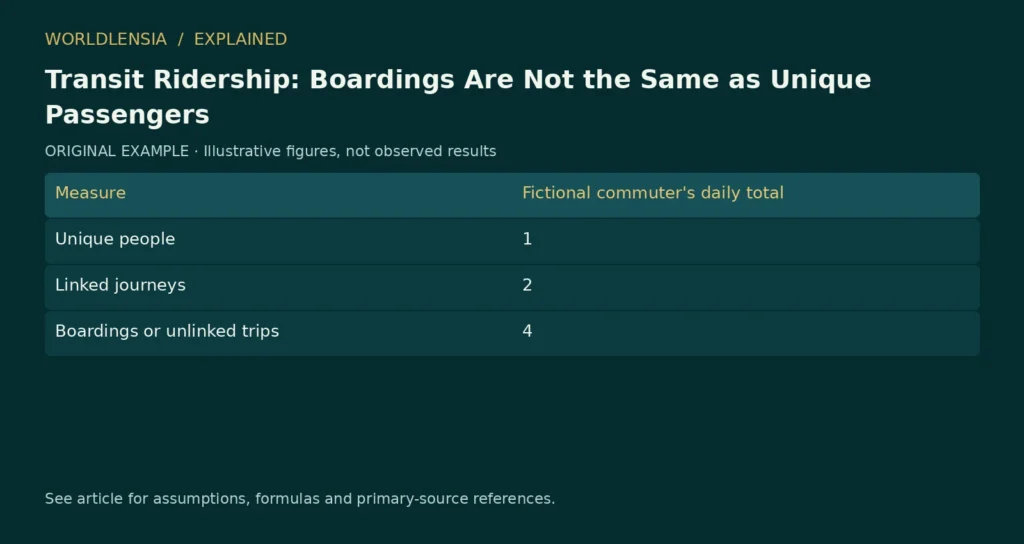
Suppose one commuter boards a bus, transfers to a train and later makes the reverse journey home. The person has made two linked journeys and four boardings. They are still one unique rider.
| Measure | Fictional commuter’s daily total |
|---|---|
| Unique people | 1 |
| Linked journeys | 2 |
| Boardings or unlinked trips | 4 |
If the network changes to a direct service with no transfer, the same person could make two linked journeys and only two boardings. A boarding count would fall even though the number of journeys and people had not changed.
This example is not an argument against boarding statistics. They help describe service use. It shows why a change in network design belongs in the interpretation.
Passenger miles add distance
Passenger miles measure distance traveled by passengers. If ten passengers each travel three miles, they generate 30 passenger miles. If ten each travel six miles, they generate 60.
The same number of boardings can therefore be associated with different distances. A system serving long regional journeys and one serving short central-city trips should not be compared as though their boarding counts alone describe equal transport work.
In a simplified example, 60 passenger miles divided by ten unlinked passenger trips gives an average of six miles per unlinked trip. Use compatible coverage and reporting periods when reproducing this measure from actual data.
Service supplied is a separate quantity
Vehicle revenue miles and hours describe service operated under the source’s definitions. They are not passenger counts. A bus traveling ten miles does not generate ten passenger miles unless the passenger occupancy over that journey produces that total.
To evaluate use relative to service, select an appropriate ratio and explain its limitations. More boardings per vehicle hour may reflect strong demand, crowding or a change in service allocation. The ratio alone cannot distinguish them.
Likewise, a lower number of passengers on a route does not prove that the route lacks social value. Accessibility, coverage, time of day and available alternatives may be relevant to a service decision.
Compare cities with matching coverage
Check which modes and agencies are included. A city-level headline may count only the municipal operator, while another includes suburban rail and regional buses. Geographic population totals may not match the service area.
Record the period, treatment of transfers, data collection method and any disruptions. An annual total covering a major shutdown should be interpreted in that context. Preliminary and revised data should be identified by release.
Our article on average commute time explains another reason transport comparisons need more than a single mean. Transit use and the distribution of journey times describe different aspects of how people travel.
A clear ridership report names its unit in the chart title. “Annual boardings” is more informative than an unexplained “passengers,” especially when readers may interpret the latter as different people. The goal is to make the counting rule visible before drawing conclusions about demand or access.
Ask what changed before celebrating a record
A fictional operator can increase boardings by redesigning routes to require transfers. Another can reduce boardings by offering direct service. Before describing a record as more people reached, look for a compatible measure of journeys or unique users and document any network changes. That check protects an otherwise accurate boarding total from being interpreted as a different result.
Sources and method
- FTA National Transit Database glossary. Living glossary; publication date not established. Checked October 20, 2026.
- FHWA transit measure explanation. Report-specific page; publication date not established. Checked October 20, 2026.
Numerical teaching examples are original and illustrative unless explicitly identified otherwise. No hands-on product testing or individual medical assessment is claimed.
To keep transit counts separate from commuting and geography measures, see City vs Metro Population: Why the Boundary Changes the Answer.