
A charger’s rated output in watts is not the energy it consumes during every hour of use. Actual electricity use depends on the connected device, the power delivered over time, conversion efficiency and any consumption while the charger is idle.
To compare products meaningfully, distinguish power at a moment from energy over an interval. Also separate power entering from the wall, power leaving the charger and energy ultimately stored in a battery.
Follow the energy path
The U.S. Department of Energy describes an external power supply as a device converting household electricity into a form suitable for a consumer product. [1] Its Energy Saver materials provide a broader framework for understanding household energy use. [2]
The simplified path is wall input, conversion in the charger, output to the device, and then any additional device or battery losses. A rating at one point is not automatically a measurement at another.
This article uses fictional operating values. It does not report a laboratory test of a charger or recommend a particular model. Actual performance depends on the product and test conditions.
Calculate a fixed operating example
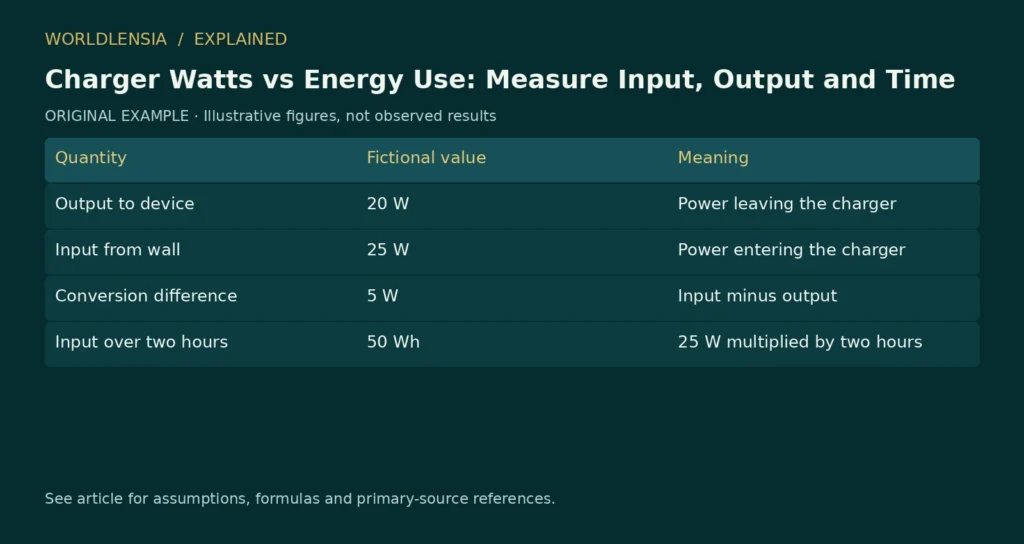
Suppose a charger delivers 20 W to a device at 80% conversion efficiency. Input power is output divided by efficiency: 20/0.80 = 25 W. The difference is 5 W under these assumptions.
| Quantity | Fictional value | Meaning |
|---|---|---|
| Output to device | 20 W | Power leaving the charger |
| Input from wall | 25 W | Power entering the charger |
| Conversion difference | 5 W | Input minus output |
| Input over two hours | 50 Wh | 25 W multiplied by two hours |
Fifty watt-hours equals 0.05 kWh. If the illustrative electricity price is 0.20 currency units per kWh, that two-hour input costs 0.01 currency units. The price is invented for calculation, not a current tariff.
The device does not necessarily store the entire 40 Wh leaving the charger over those two hours. It may operate while charging and incur additional losses. A battery-energy estimate requires its own boundary.
Why the maximum rating is not a constant draw
A charger capable of a particular output does not necessarily deliver that maximum to every connected device. The device, supported charging mode, cable and operating state affect the actual transfer.
For a realistic comparison, measure or obtain documented results for a relevant workload. A peak rating alone cannot establish how much electricity a full charging cycle uses or how quickly a particular device charges.
Charging power can vary during the session. Multiplying the highest observed power by the entire duration can therefore overstate energy. Integrating the actual power over time, or using an appropriate energy meter, answers the energy question more directly.
Idle consumption is a separate calculation
Suppose a fictional unplugged-from-device charger remains connected to the wall and draws 0.1 W continuously for a year. Using 365 days, its energy would be 0.1 × 24 × 365 = 876 Wh, or 0.876 kWh.
That example assumes constant idle power. It does not claim all chargers consume 0.1 W. Product-specific no-load measurements and relevant test conditions are needed for an actual estimate.
Keep idle and active energy separate in a comparison. A highly efficient active mode does not by itself describe the idle mode, and a low idle value does not establish performance while charging.
Match the test conditions
Efficiency can depend on load. Comparing one product at a small fraction of capacity with another at full load may not answer which performs better for your device. Record output power, voltage mode, ambient conditions and measurement method where available.
Cables matter to compatibility and losses as well. Our USB-C cable guide explains why charging capability, data transfer and display support are separate checks. A suitable charger does not automatically make every cable suitable for its maximum output.
Avoid assuming that a compliance mark or efficiency label establishes charging compatibility with a particular device. Read the product’s supported outputs and the device’s requirements separately.
Report the result with its boundary
A useful energy statement says whether it measures electricity at the wall, power delivered to a device or energy stored in a battery. It includes the duration or completed task and identifies whether the numbers are measured, manufacturer-reported or illustrative.
For cost, multiply kWh by the actual applicable rate and explain any excluded tariff components. Do not present a fictional example price as a customer’s guaranteed cost.
The practical comparison is energy required to complete a defined task under matching conditions. That tells a reader more than treating the largest watt number on the box as either constant consumption or guaranteed charging speed.
Compare a completed task rather than a momentary peak
Consider two fictional charging sessions that deliver the same useful device outcome. Session A draws an average of 25 W for two hours, consuming 50 Wh. Session B draws an average of 40 W for 1.25 hours, also consuming 50 Wh. A higher average power does not necessarily mean more energy for the completed task.
The examples assume the averages already account for variation during each session. Real measurements should record the full interval and define the starting and ending device states. A comparison beginning at different battery levels does not test the same task.
If a product review reports only the peak wattage, it has not supplied enough information to reproduce the total energy. Ask for watt-hours at the wall and the completed task before inferring electricity cost.
For mobile readers, a two-column comparison showing task and measured energy is often clearer than a crowded chart mixing watts, watt-hours and currency on one axis. Keep each unit attached to the value it describes.
A measurement note should also identify the instrument and its resolution. Very small idle loads can be difficult to assess with a coarse meter, so an apparent zero should not automatically be treated as exact zero consumption. Use suitable documented measurements and state their limits. The example calculations here remain illustrations even when their arithmetic is exact; they do not establish the behavior of a charger that has not been tested.
Sources and method
- DOE external power supplies. Living program page; publication date not established. Checked October 20, 2026.
- DOE Energy Saver guide. 2022. Checked October 20, 2026.
Numerical teaching examples are original and illustrative unless explicitly identified otherwise. No hands-on product testing or individual medical assessment is claimed.
To check the cable and workload behind charging figures, see Laptop Battery Life: Compare Watt-Hours, Workloads and Battery Health.