
Fast inventory turnover can look like a sign of efficiency. It can also accompany empty shelves, missed sales, or a seasonal timing effect. The ratio is useful when its inputs and business context are visible. It becomes less useful when a single number is treated as an automatic performance grade.
At a glance
- Inventory turnover commonly compares cost of sales with average inventory.
- Match the time period and cost basis.
- A higher turnover ratio is not always better.
Calculate a consistent ratio
The SEC’s financial-statement guide describes inventory turnover using cost of sales and average inventory. The cost basis matters: dividing retail sales by inventory recorded at cost mixes different measurement bases unless that alternative is deliberately defined.
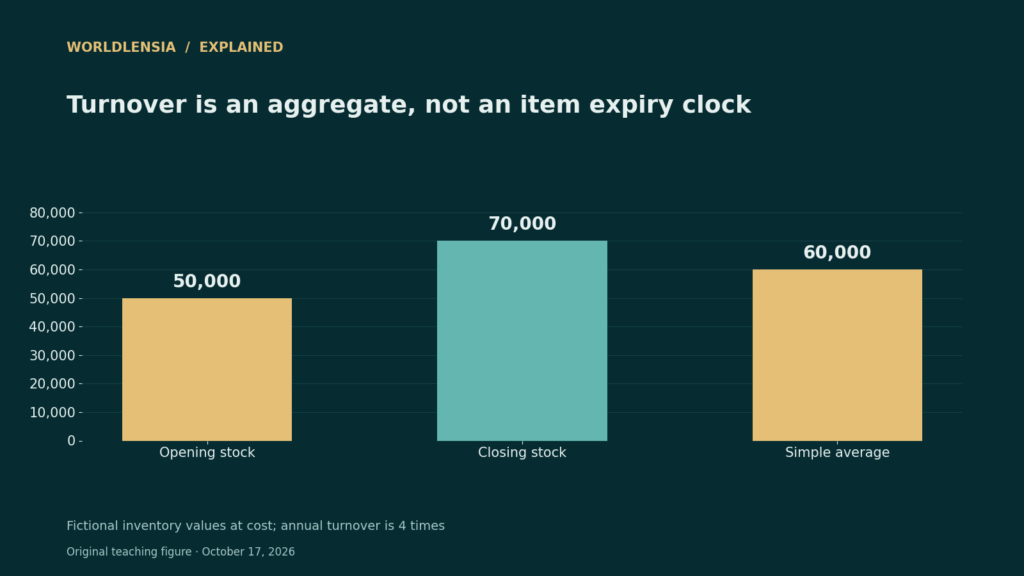
A simple average uses opening plus closing inventory divided by two. It can be a rough approximation when stock fluctuates sharply. Monthly or more frequent averages may better reflect the business, provided the calculation is disclosed and used consistently.
A fictional annual example
Suppose annual cost of sales is $240,000. Opening inventory is $50,000 and closing inventory is $70,000. The simple average is $60,000, so turnover is four times for the year. Dividing 365 by four gives about 91 days of inventory under this simplified convention.
That does not mean every item sat for 91 days. Some lines may sell weekly while others remain for months. The aggregate ratio cannot reveal the distribution without item-level information. It also does not establish the physical age or expiry date of any unit.
Ask what changed behind the number
If turnover rises because average inventory fell, investigate stock availability. Were service levels maintained, or did popular items sell out? If turnover falls, ask about deliberate stock-building, delayed shipments, weak sales, or seasonal purchases before assigning a cause.
Compare similar business models and accounting periods. A grocer and a furniture retailer can have very different inventory needs. Keep returns, write-downs, and unusual changes in product mix in view. The ratio should prompt questions rather than replace the operational review.
A practical comparison
| Fictional annual measure | Calculation | Result |
|---|---|---|
| Average inventory | ($50,000 + $70,000) / 2 | $60,000 |
| Turnover | $240,000 / $60,000 | 4 times |
| Days on hand | 365 / 4 | About 91 days |
Before using the result
- Use consistent cost bases.
- Inspect item-level availability and aging.
- Do not compare dissimilar retailers without context.
Continue exploring: more company performance guides.
Sources and methodology
Reviewed October 17, 2026. WorldLensia explanatory analysis. Worked examples and the accompanying teaching figure are illustrative, not measured findings or product tests. Consult the linked source for definitions and revisions.
To connect the stock ratio with delivery variability and cash needs, see Why Average Lead Time Is Not Enough for an Inventory Buffer and Cash Conversion Cycle: Why Growth Can Tie Up Cash.