Explore WorldLensia research and data guides: clear explanations of how public numbers are defined, compared and interpreted. Use this page to browse recent articles, then check each article for its source, time period, units and geographic coverage.
What you will find
Our research covers economics, finance, U.S. cities, public health, technology, business, sports, products and real estate. Guides focus on practical distinctions that can change what a statistic means, such as a rate versus a count, a nominal versus inflation-adjusted value, or one geographic boundary versus another.
How to read a data guide
Start with the question and definition. Confirm which population or unit is measured, the period covered, and whether the figure is an estimate or a final count. When sources use different definitions, compare like with like. If an article shows a derived calculation, use its stated inputs and formula to check the result.
Public data can be revised, incomplete or uncertain. A pattern in a chart does not by itself prove a cause, describe every individual, or forecast what will happen next. Read the limitations and linked primary sources before applying a number to a decision.
Sources and feedback
For our general source-selection and calculation standards, see Sources & Methodology. To report an error, suggest a topic or ask a question, visit Contact WorldLensia. Browse the latest research below; use the page navigation to reach earlier articles.
Practical worksheets and comparison resources
Use these free resources alongside the linked guides. Check each resource’s definitions and source notes before sharing a comparison.
- Grocery budgeting lesson: student activity and teacher key: a 15-minute exercise with fictional receipts, an offline option and September 2026 worked answers.
- USDA grocery budget calculator: add household members, compare weekly and monthly food-at-home benchmarks across four plans, and download a summary with the source month and household-size adjustment.
- Grocery receipt worksheet for one person: separate food from nonfood purchases before comparing spending with a food-budget benchmark.
- City-growth comparison card: distinguish percentage growth from residents added, with a fictional worked example and a real Census comparison.
- City-growth comparison workbook (Excel, 9 KB): inspect the Census Bureau’s separate top-15 percentage-growth and numeric-gain lists for July 1, 2024–July 1, 2025, using Vintage 2025 estimates and the 20,000-resident starting threshold. It is a WorldLensia compilation, not a complete national city dataset.
These explanatory resources were prepared with AI assistance. Primary-source figures, derived calculations and fictional examples are identified separately. For a source question or correction, email info@worldlensia.com and include the resource title and the figure or passage you are checking.
Browse all research guides by topic
Choose a topic below for a specific explanation. Each guide retains its own observation period, examples, source links and limitations; a recent edit does not necessarily mean the underlying data are new.
Economy & Finance
- USDA Grocery Budget for a Family of Four: 2026 Worked Example
- How to Compare Grocery Spending with USDA Food Plans
- A Pay Rise and Real Earnings: Compare Wages with Prices and Hours
- Annualized GDP Growth: A Quarterly Pace Is Not a Yearly Forecast
- GDP and GDI: Two Measurements of the Same Economy Can Differ
- GDP per Capita: Why Economic Growth Can Outrun the Gain per Person
- Goods Deficit, Services Surplus: Read the Whole Trade Balance
- Gross Output vs Value Added: Follow a Product Through the Supply Chain
- IMF Fiscal Monitor 2026: Why Tax Design Matters for Growth
- IMF October 2026 Outlook: What 3.1% Global Growth Means
- Mean vs Median Income: The Average Can Rise While Most Households Stand Still
- Nominal vs Real GDP: How to Separate Prices from Growth
- Percent vs Percentage Points: Avoid a Misleading Comparison
- Rebasing an Index: New Levels, Same Percentage Change
- Seasonally Adjusted vs Unadjusted Data: Which Should You Use?
- September 2026 CPI: Headline vs Core Inflation Explained
- September 2026 Jobs Report: Payrolls and Unemployment Differ
- USDA Grocery Budget for One Person in 2026: Monthly Cost Guide
- Unemployment and Participation: Two Rates, Two Different Denominators
- Why Chained-Dollar GDP Components Do Not Simply Add Up
- Why GDP Estimates Change: Read Releases as Data Vintages
- Your Inflation Rate vs the CPI: Spending Weights Explain the Gap
Countries & Cities
- ACS Margins of Error: When a City Ranking Is Too Precise
- ACS One-Year vs Five-Year Estimates: Match the Time Window
- Average Commute Time: What a City Ranking Leaves Out
- City Growth Rate vs Residents Added: A Worked Comparison
- City vs Metro Population: Why the Boundary Changes the Answer
- Climate Anomalies: The Baseline Is Part of the Number
- Comparing City Rents: Asking Rent, Contract Rent and Gross Rent Answer Different Questions
- Disaster Risk Reduction 2026: What Makes a City Resilient?
- Electricity Capacity and Generation: Compare Power with Energy
- Fastest-Growing U.S. Cities in 2025: Percentage vs. Population Gains
- How a City Ranking Can Reverse When You Compare Like with Like
- Missing, Suppressed and Zero: Three Different Public-Data States
- Net Migration vs Population Growth: Account for Inflows and Outflows
- PPP vs Exchange Rates: Compare Countries Without Mixing Questions
- Population Density: Why a City Average Can Hide How People Actually Live
- Poverty Day 2026: How to Read City Poverty Data Fairly
- Transit Ridership: Boardings Are Not the Same as Unique Passengers
- Urban Heat Maps: Surface Temperature Is Not Air Temperature
- Water Withdrawal vs Consumption: Read City Water Claims Carefully
- Why a High Survey Response Rate Does Not Prove Full Coverage
- World Cities Day 2026: How to Judge Urban Regeneration
Technology & AI
- AI Benchmark Accuracy vs Task Success: Build a Fair Test
- AI Data Drift: Detect a Change Before Deciding to Retrain
- AI Probability Calibration: Does an 80% Score Mean What You Think?
- AI Research Workflow: A 7-Step Source Verification Checklist
- AI Response Time: Measure the Workflow Before Optimizing the Model
- AI Temperature Settings: Why Less Random Does Not Mean More Factual
- AI Voice Cloning Scam: How to Verify a Family Emergency Call
- Build an AI Citation Audit: A Source Ledger That Catches Gaps
- Data Leakage: Why a Clean Test Split Matters More Than a Strong Score
- How to Read a Model Card Without Treating It as Certification
- Human Review for AI: Design a Decision Process, Not a Rubber Stamp
- Meta Muse Wonder: How to Evaluate AI Agents for Real Work
- Missing Values in AI Data: Imputation Changes the Evidence
- NIST’s AI Cybersecurity Draft: From Summary to Evidence
- Precision, Recall and Accuracy: Build an AI Evaluation That Matches the Job
- Prompt Injection in Documents: A Checklist for AI Assistants
- Quantization: Smaller Model Weights Do Not Tell the Whole Memory Story
- RAG Chunking: Preserve the Evidence Before You Tune the Answer
- RAG Retrieval Evaluation: Check the Evidence Before Grading the Answer
- RAG vs Fine-Tuning: Choose the Right Fix for an AI System
- Reproducing an AI Result: Record More Than the Random Seed
- Valid JSON Is Not a Verified Answer: Check AI Structured Outputs
- WeatherNext 3: How to Judge an AI Weather Forecast
- What an AI Detector Score Can—and Cannot—Prove
- Why a Cosine Similarity Score Is Not a Probability
Business & Industry
- 2/10 Net 30 Payment Terms: Formula, Examples, and Due Dates
- A Higher Average Order Value Can Hide Fewer Orders
- Allocated Cost and Incremental Cost Answer Different Decisions
- Bookings, Billings and Revenue: Three Dates in One Customer Contract
- Break-Even Analysis: Test Price, Costs and Capacity Before Trusting the Sales Target
- Business Backlog: Future Work Is Not the Same as Earned Revenue
- Capacity Utilization: A Busy Factory Can Still Have a Bottleneck
- Cash Conversion Cycle: Why Growth Can Tie Up Cash
- Cash Runway: Replace One Burn Rate with a Dated Cash Forecast
- Customer Retention: Follow the Same Cohort Before Celebrating Growth
- Gross Margin vs Markup: Price a Product Without Mixing Formulas
- IEA October 2026 Oil Report: A Guide for Business Costs
- Inventory Turnover and Days on Hand: Read the Ratio Carefully
- Market Concentration and the HHI: Define the Market Before Squaring the Shares
- Returns and Reversals: Which Reporting Date Does the Number Describe?
- Revenue per Employee Is Not the Same as Labor Productivity
- Revenue, Profit and Cash Flow: Three Different Business Signals
- TSMC Q3 2026 Earnings: Revenue, Margins and the AI Story
- Why Average Lead Time Is Not Enough for an Inventory Buffer
- World Food Day 2026: A Better Test for Food Supply-Chain Innovation
Sports & Statistics
- Batting Average vs On-Base Percentage: Walks Change the Comparison
- Champions League Matchday 2: What 78 Goals Actually Tell Us
- Cricket Net Run Rate: Aggregate Runs and Overs Before Comparing
- Do Both Teams Get the Ball in NFL Overtime? 2026 Rules Explained
- Europa League October 15: Four Results, Four Statistical Lessons
- Expected Goals vs the Scoreline: Read Football Chances Fairly
- F1 Undercut vs Overcut: The Timing Behind a Pit-Stop Gain
- Football Possession: More of the Ball Does Not Identify the Cause of a Win
- Points per Game vs Points per Possession: Separate Basketball Pace from Efficiency
- U.S. Grand Prix 2026: Austin Schedule and Time-Zone Guide
- Why Winning More Tennis Points Does Not Guarantee Winning the Match
- Winning Percentage: Compare the Record, the Sample and the Rules
Healthcare & Public Data
- Absolute vs Relative Risk: Put Health Headlines in Context
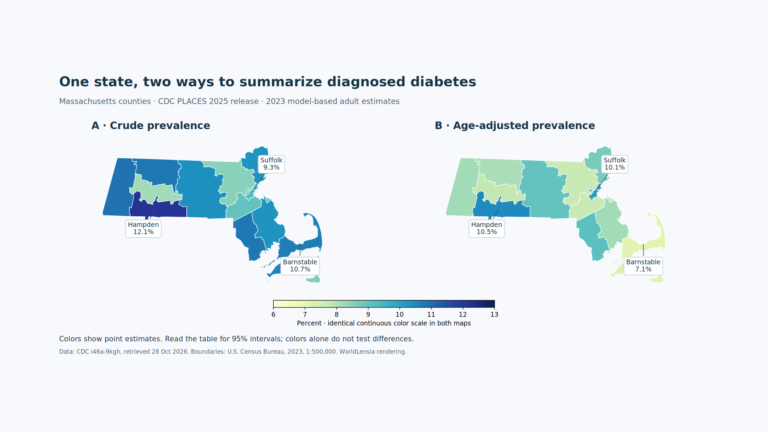
- Age-Adjusted vs Crude Health Rates: Compare Populations Fairly
- Breast Cancer Awareness 2026: Reading the Care Data
- County Health Maps: A Place-Level Pattern Does Not Identify Individual Risk
- Incidence and Prevalence: New Cases and Existing Cases Are Different
- Lead Prevention Week 2026: From Detection to Prevention
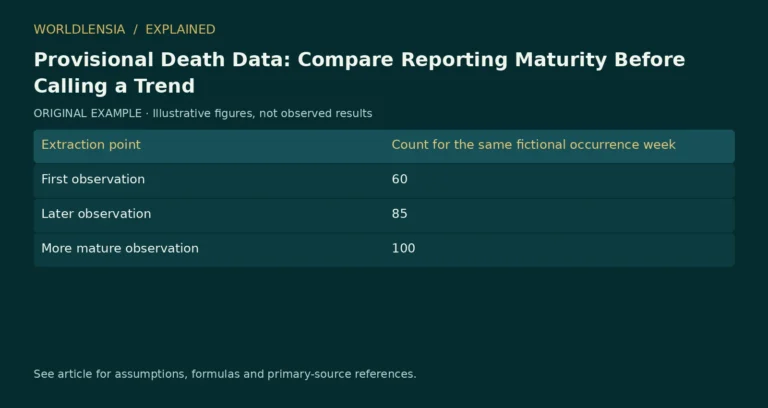
- Provisional Death Data: Compare Reporting Maturity Before Calling a Trend
- Reported and Measured Health Data: Compare the Method Before the Percentage
- Sensitivity, Specificity and Predictive Value: Read a Test Result Without Reversing the Probability
- Uninsured Rates by State: 2024 Data and Age-Group Overview
- Vaccination Coverage: Check the Dose, Age Group and Denominator Before Comparing Countries
- WHO Hand-Hygiene Toolkit 2026: Why Access Matters
Products
- Air-Cleaner CADR: Read the Room-Size Assumptions
- Charger Watts vs Energy Use: Measure Input, Output and Time
- Galaxy SmartTag3: Check Compatibility Before You Buy
- IP Ratings: Read Water and Dust Protection as Separate Claims
- Laptop Battery Life: Compare Watt-Hours, Workloads and Battery Health
- Pixel October 2026 Update: What the Patch Level Means
- Refresh Rate, Frame Rate and Pixel Response Time Are Different
- Refurbished Electronics: A Checklist Beyond the Discount
- USB-C Cables: Check Charging, Data and Display Separately
- Why a 1 TB Drive Appears Smaller: Bytes, Units and Free Space
- iPhone Duo Pre-Orders Open October 16: Buyer Checklist
Real Estate
- Cap Rate vs Cash-on-Cash Return: Separate the Property from Its Financing
- FHFA October 2026 HPI: Release Date vs Data Month
- House Prices vs Affordability: Why an Index Is Not a Budget
- Housing Starts vs Permits: Reading the Supply Pipeline
- Median Home Sale Prices: A Changing Mix Can Move the Headline
- Months Supply Is Not a Forecast of How Long a Home Will Take to Sell
- Mortgage APR vs Interest Rate: Compare the Full Loan Estimate
- Mortgage Rates on October 16, 2026: What 7.40% Means
- Price per Square Foot: Compare the Area Definition Before the Ratio
- Property Taxes After Buying a House: How to Estimate Your New Bill
- Rent vs Buy: Compare Cash, Equity and Risk on the Same Timeline
- Rental and Homeowner Vacancy Rates Use Different Inventories
Check an AI answer against its evidence
Use the AI Answer Review Worksheet: Check Answers Against Evidence to separate formatting, factual support and action risk. For publication standards and correction details, read About WorldLensia and Sources & Methodology.